
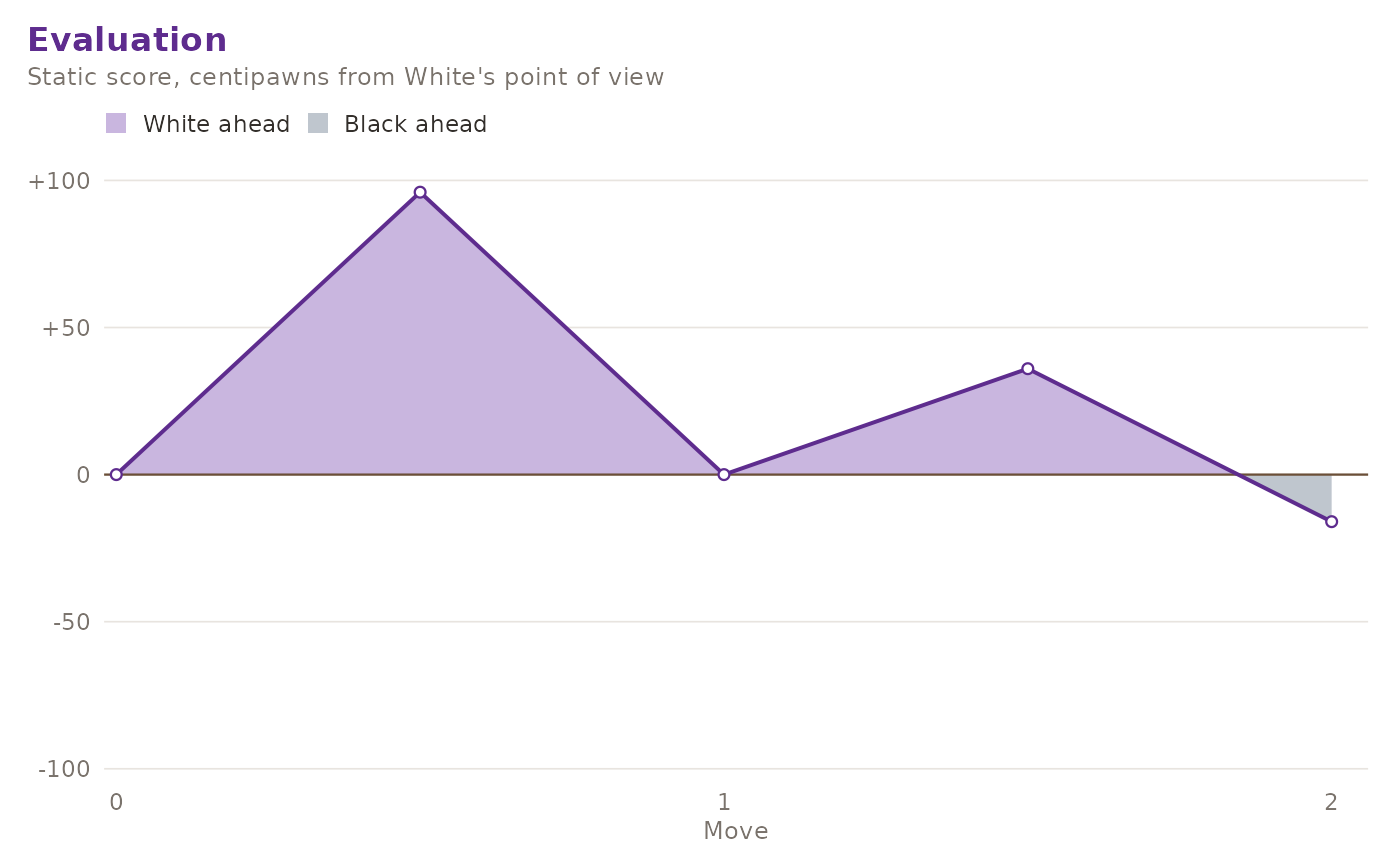
Visualise how the evaluation changes across the moves of a game. The area between the curve and the axis is filled towards whichever side is ahead, split exactly at the ply where the advantage changes hands.
Arguments
- game
A gm_game object.
- depth
Search depth for per-move evaluation. Default
1(static).
Details
With depth = 1 each position is scored by gm_evaluate(). A larger
depth re-scores every position with gm_bestmove(), which is far slower
but accounts for tactics. Forced mates are clamped for display so a single
mate score cannot flatten the rest of the curve.
See also
Other visualization:
gm_plot_board()
Examples
# \donttest{
gm_plot_eval(gm_read_pgn("1. e4 e5 2. Nf3 Nc6 *", text = TRUE))
 # }