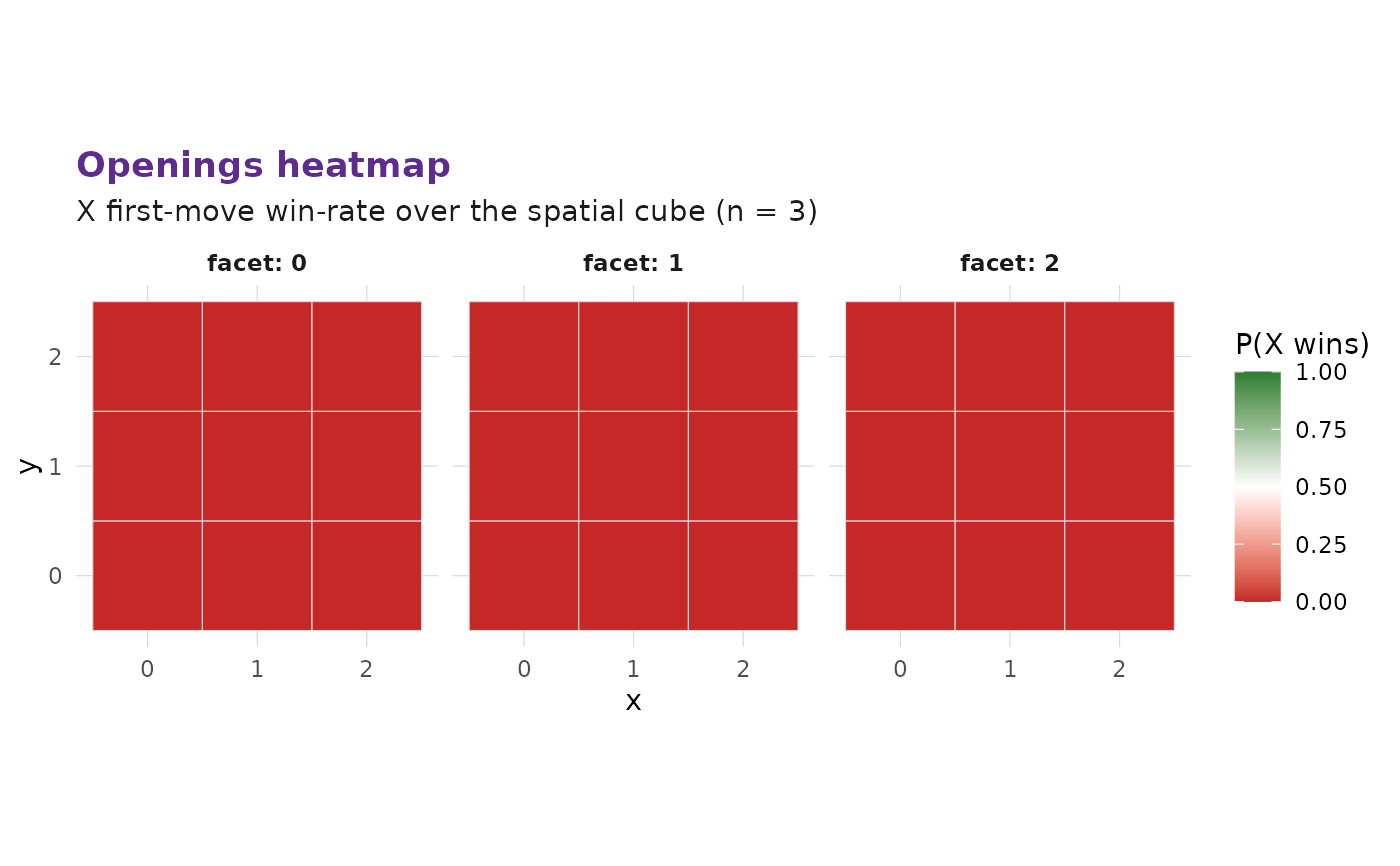
Consumes the output of mxo_opening_table() and renders X's first-move
win-rate as a faceted-by-z heatmap.
Arguments
- opening_table
The tibble produced by
mxo_opening_table().- n, d_spatial
Geometry parameters used to derive cell coordinates.
- ...
Unused.
Examples
ot <- mxo_opening_table(n_games_per_cell = 1L,
                        config = mxo_config_default(n = 3L, ply_cap = 2L),
                        seed = 1L)
mxo_plot_opening(ot, n = 3L)