Nodes are timelines, edges are parent->child branches drawn at the branching time. Layout: x = branch_t (root at x = 0), y = timeline label spread vertically.
Examples
mxo_plot_tree(mxo_example_game())
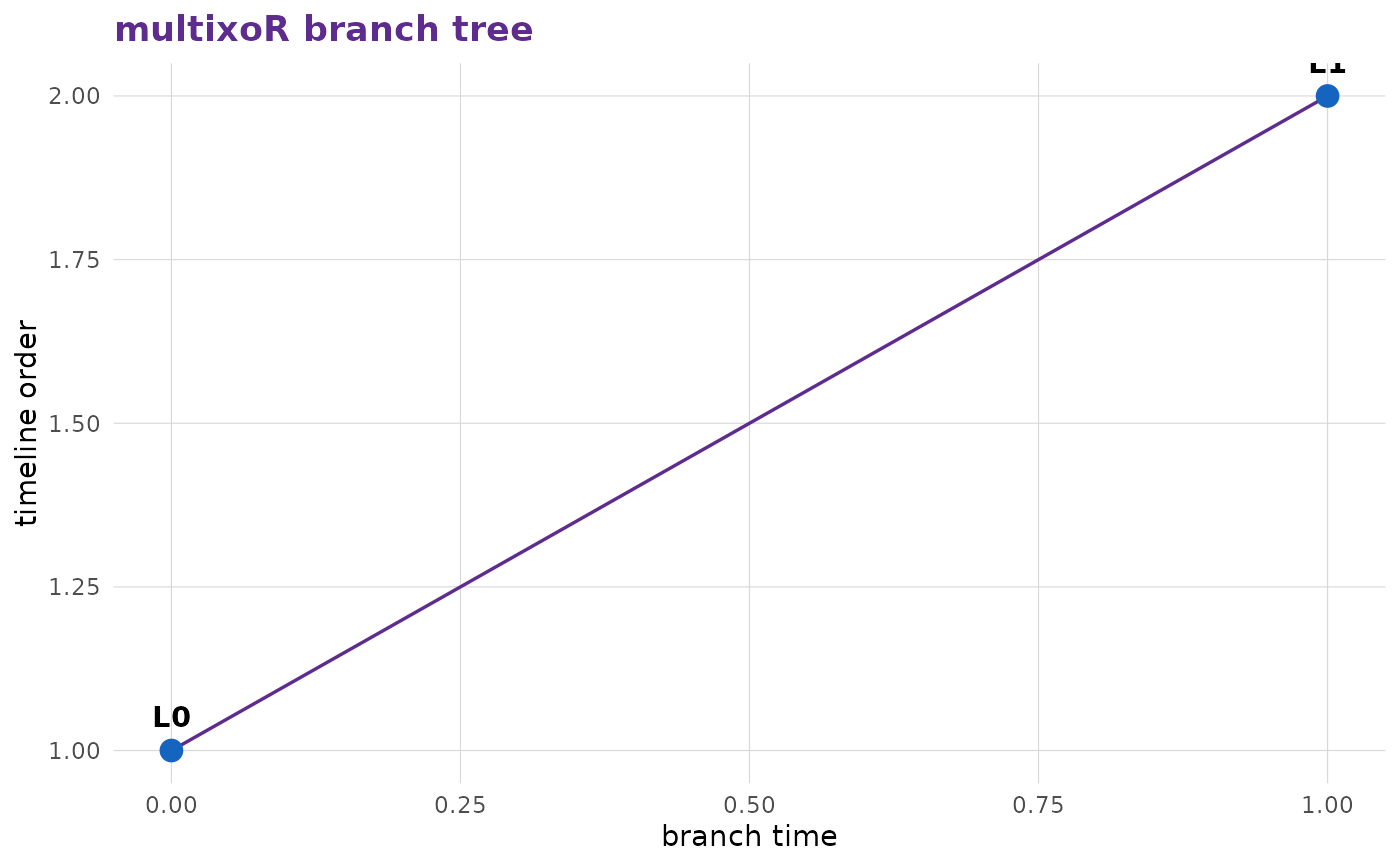
Nodes are timelines, edges are parent->child branches drawn at the branching time. Layout: x = branch_t (root at x = 0), y = timeline label spread vertically.
mxo_plot_tree(mxo_example_game())