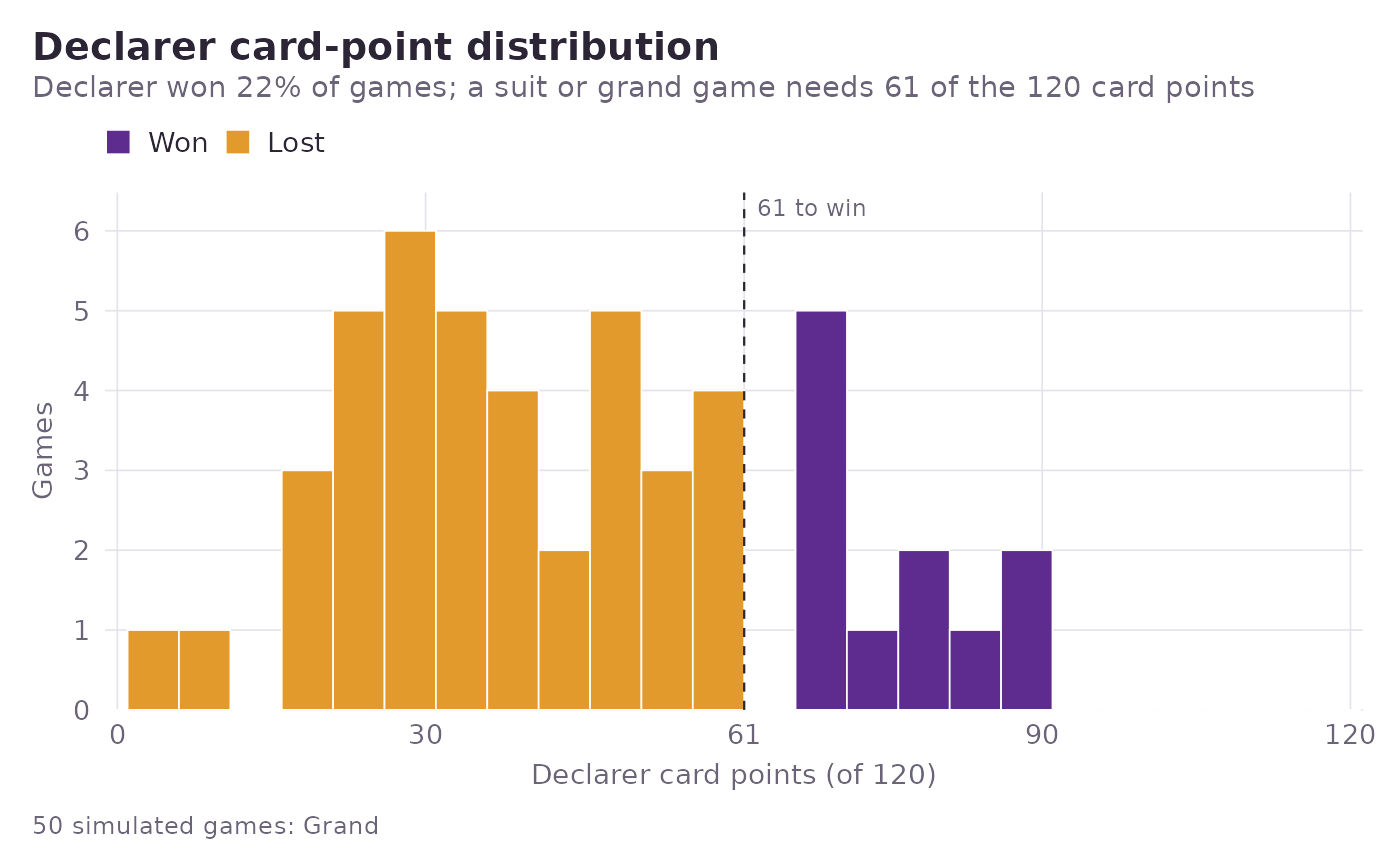
Draws a histogram of the declarer's card points across a simulation, split by outcome, on the full 0-120 point scale with the 61-point winning threshold marked.
Usage
sk_plot_points(sim, bins = 24, call = rlang::caller_env())Arguments
- sim
A simulation tibble from
sk_simulate().- bins
Approximate number of histogram bins across the 0-120 point range. Defaults to 24 (five points wide). Bin edges are anchored on 61, so no bin straddles the winning threshold and each bar of a suit or grand simulation is a single colour.
- call
The calling environment, used for error reporting.
Value
A ggplot2::ggplot() object, which can be printed, saved with
ggplot2::ggsave(), or extended with further layers.
See also
sk_plot_winrate() for the aggregate view.
Other plotting functions:
sk_plot_winrate()
Examples
sim <- sk_simulate(n = 50, seed = 1, verbose = FALSE)
sk_plot_points(sim)