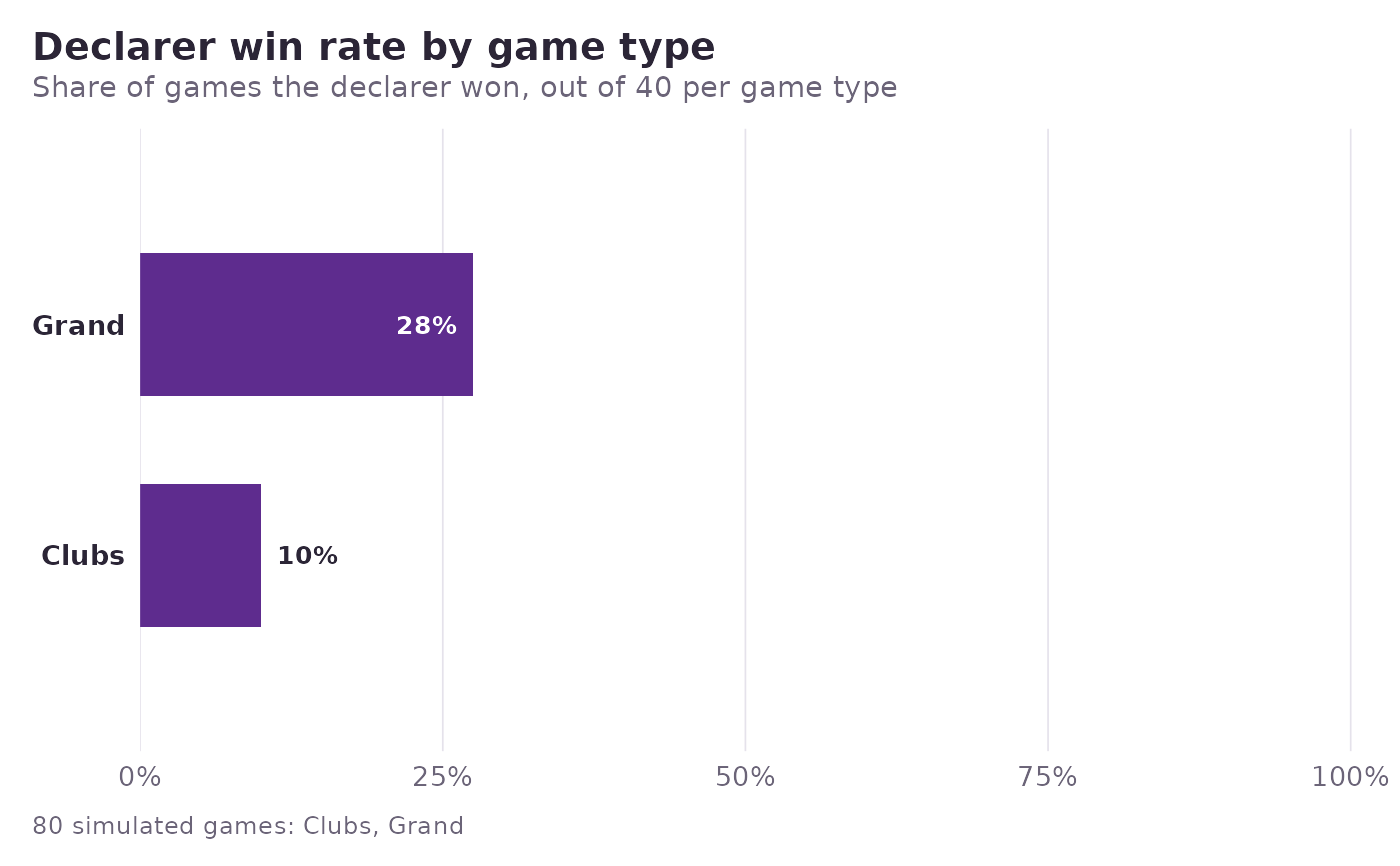
Summarises one or more simulation tibbles into a bar chart of the declarer's win rate per game type, best at the top.
Usage
sk_plot_winrate(sim, call = rlang::caller_env())Arguments
- sim
A simulation tibble from
sk_simulate(), or several row-bound together (with differinggame_typevalues).- call
The calling environment, used for error reporting.
Value
A ggplot2::ggplot() object, which can be printed, saved with
ggplot2::ggsave(), or extended with further layers.
See also
sk_plot_points() for the per-game distribution.
Other plotting functions:
sk_plot_points()
Examples
a <- sk_simulate(n = 40, game_type = "grand", seed = 1, verbose = FALSE)
b <- sk_simulate(n = 40, game_type = "clubs", seed = 2, verbose = FALSE)
sk_plot_winrate(rbind(a, b))