This is a four-part tutorial on how to play tesseractR. You are on page 1. Next: Playing in the app »
From a square to a tesseract
Ordinary tic-tac-toe is played on a 3×3 square: a line of three wins.
tesseractR lifts the same idea into four
dimensions. The board is a 4×4×4×4 hypercube —
a tesseract — with 256 cells. A line of
four marks wins.
Every cell has four coordinates (i, j, k, l), each in
0:3:
-
i,j— position inside one little 4×4 board, -
k,l— which little board, within the outer 4×4 grid of boards.
Each cell also has a single linear index in 1:256, which
is how you refer to a cell with cell =:
\text{idx} = 1 + i + 4j + 16k + 64l.
So (0, 0, 0, 0) is cell 1, and
(0, 0, 0, 1) is cell 65.
Reading the board
tsr_plot() draws the hypercube as a 4×4 outer
grid of 4×4 boards. The outer grid is indexed by
(k, l); each inner board by (i, j). An empty
board:
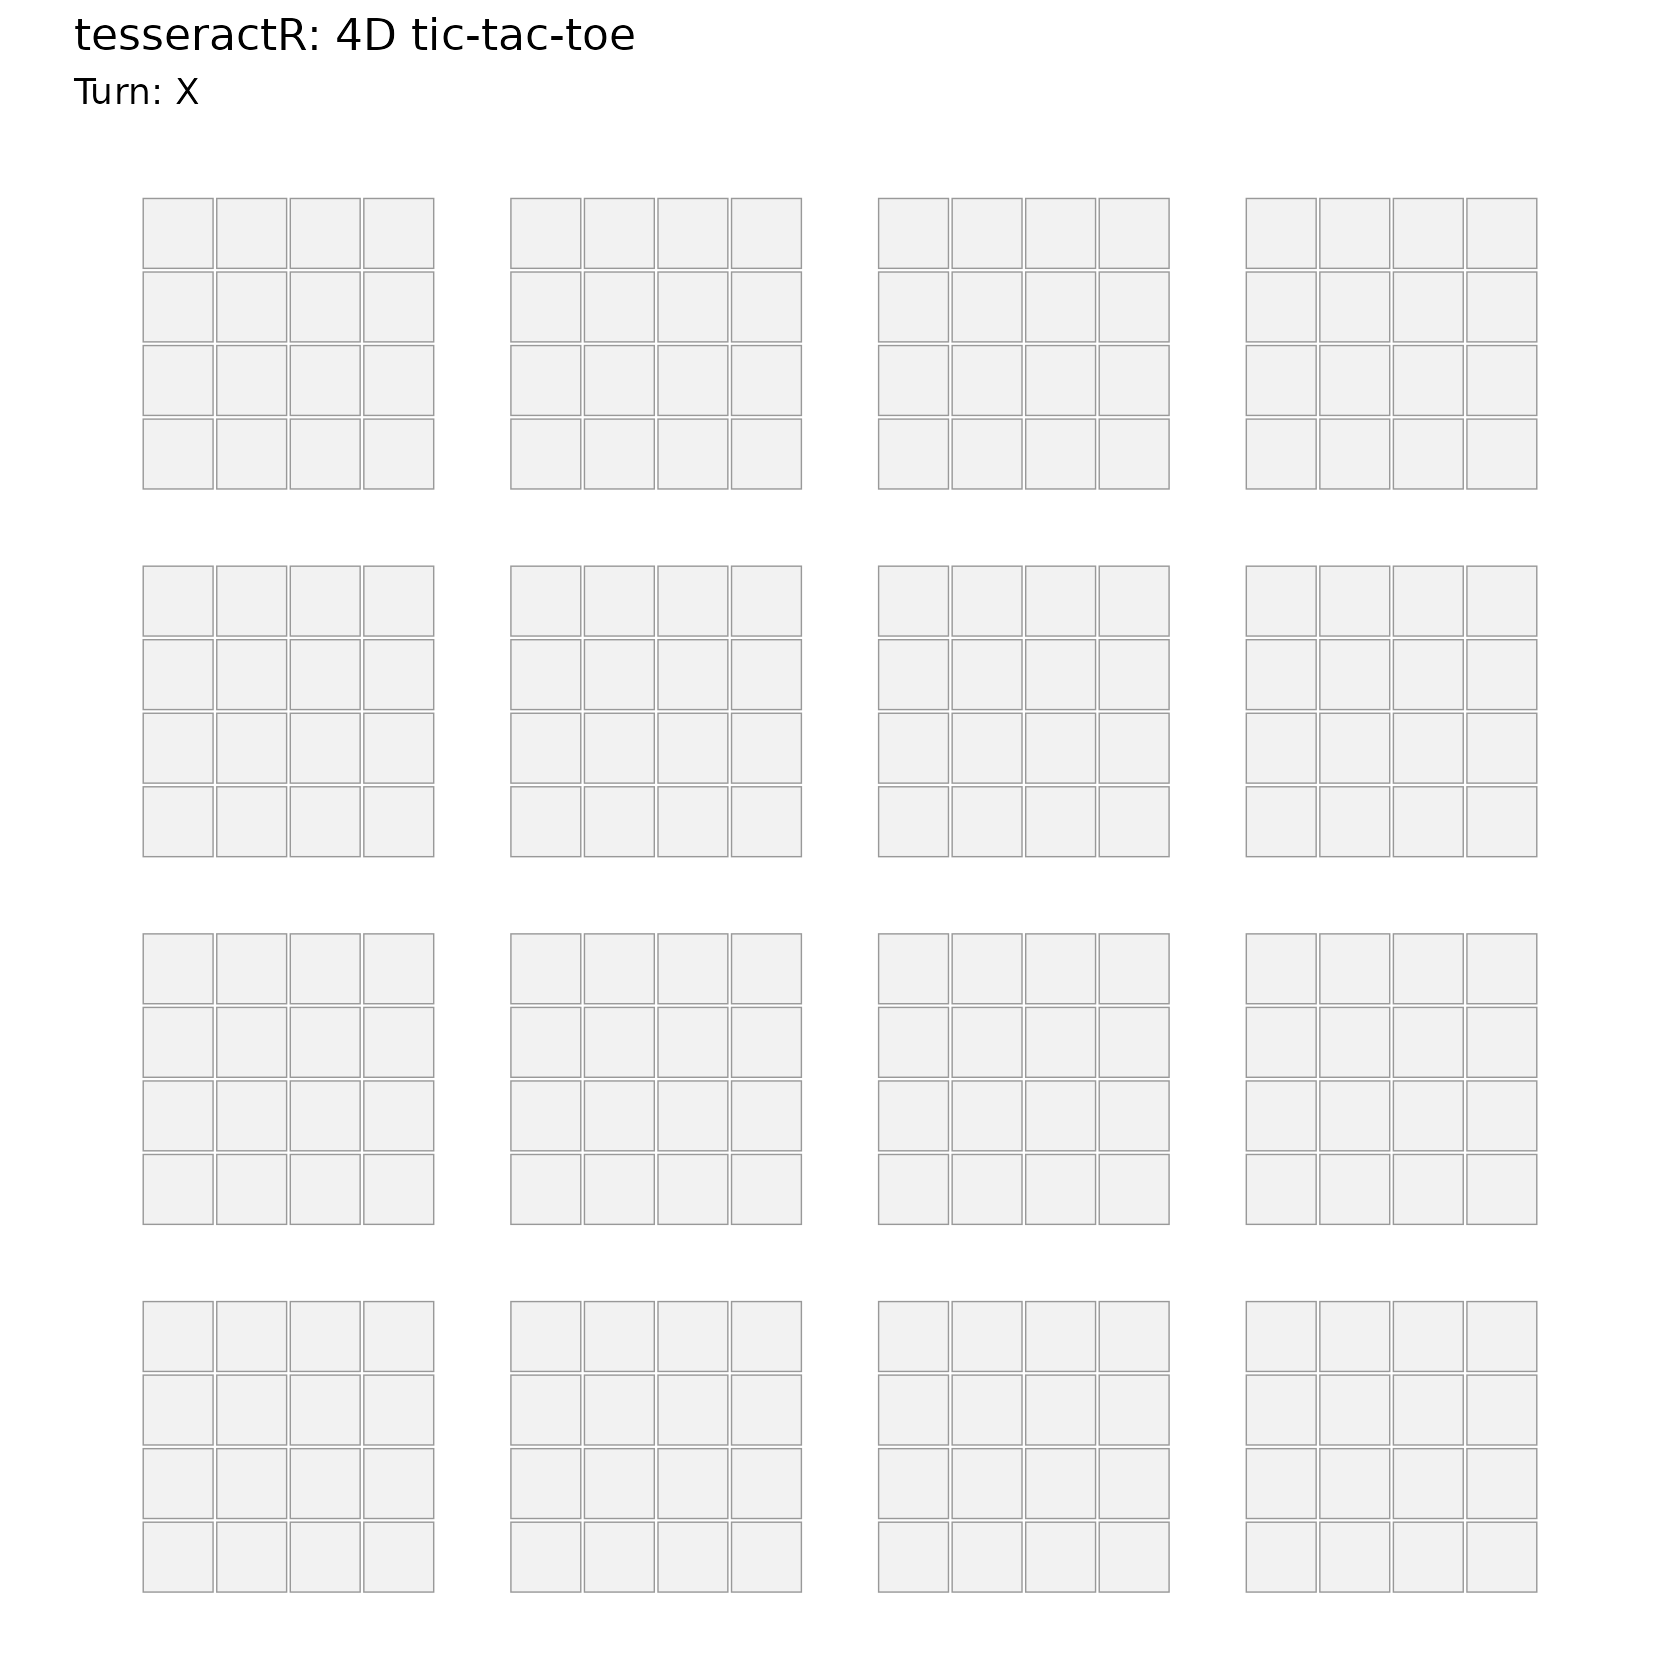
Player X is the blue mark, player O is the orange mark (the colour-blind friendly Okabe–Ito palette). X always moves first.
What is a winning line?
A line is any four cells whose successive coordinate
differences equal a constant non-zero step in {-1, 0, 1}^4.
That single rule covers a lot of geometry:
-
straight rows inside one little board (vary
i, holdj, k, l), - lines that march across boards (vary
korl), - and full four-dimensional diagonals that change all four coordinates at once.
After collapsing each line and its reverse, there are
\frac{(n+2)^d - n^d}{2} = \frac{6^4 - 4^4}{2} = 520
winning lines for d = n = 4 — far more than the 8 lines
of the 3×3 game, which is exactly what makes four dimensions hard to
hold in your head.
Here is a finished game where X has completed a line of four. When
the game is over, tsr_plot() rings the winning cells in
pink:
b <- tsr_new_board()
moves <- list(
  c(0, 0, 0, 0), c(0, 1, 0, 0),   # X, O
  c(1, 0, 0, 0), c(1, 1, 0, 0),   # X, O
  c(2, 0, 0, 0), c(2, 1, 0, 0),   # X, O
  c(3, 0, 0, 0)                    # X completes i = 0..3 at j=k=l=0
)
for (m in moves) b <- tsr_move(b, m[1], m[2], m[3], m[4])

tsr_status(b)
#> # A tibble: 1 × 6
#>   winner is_full is_over n_moves to_move n_legal
#>    <int> <lgl>   <lgl>     <int>   <int>   <int>
#> 1      1 FALSE   TRUE          7       2       0
tsr_plot(b)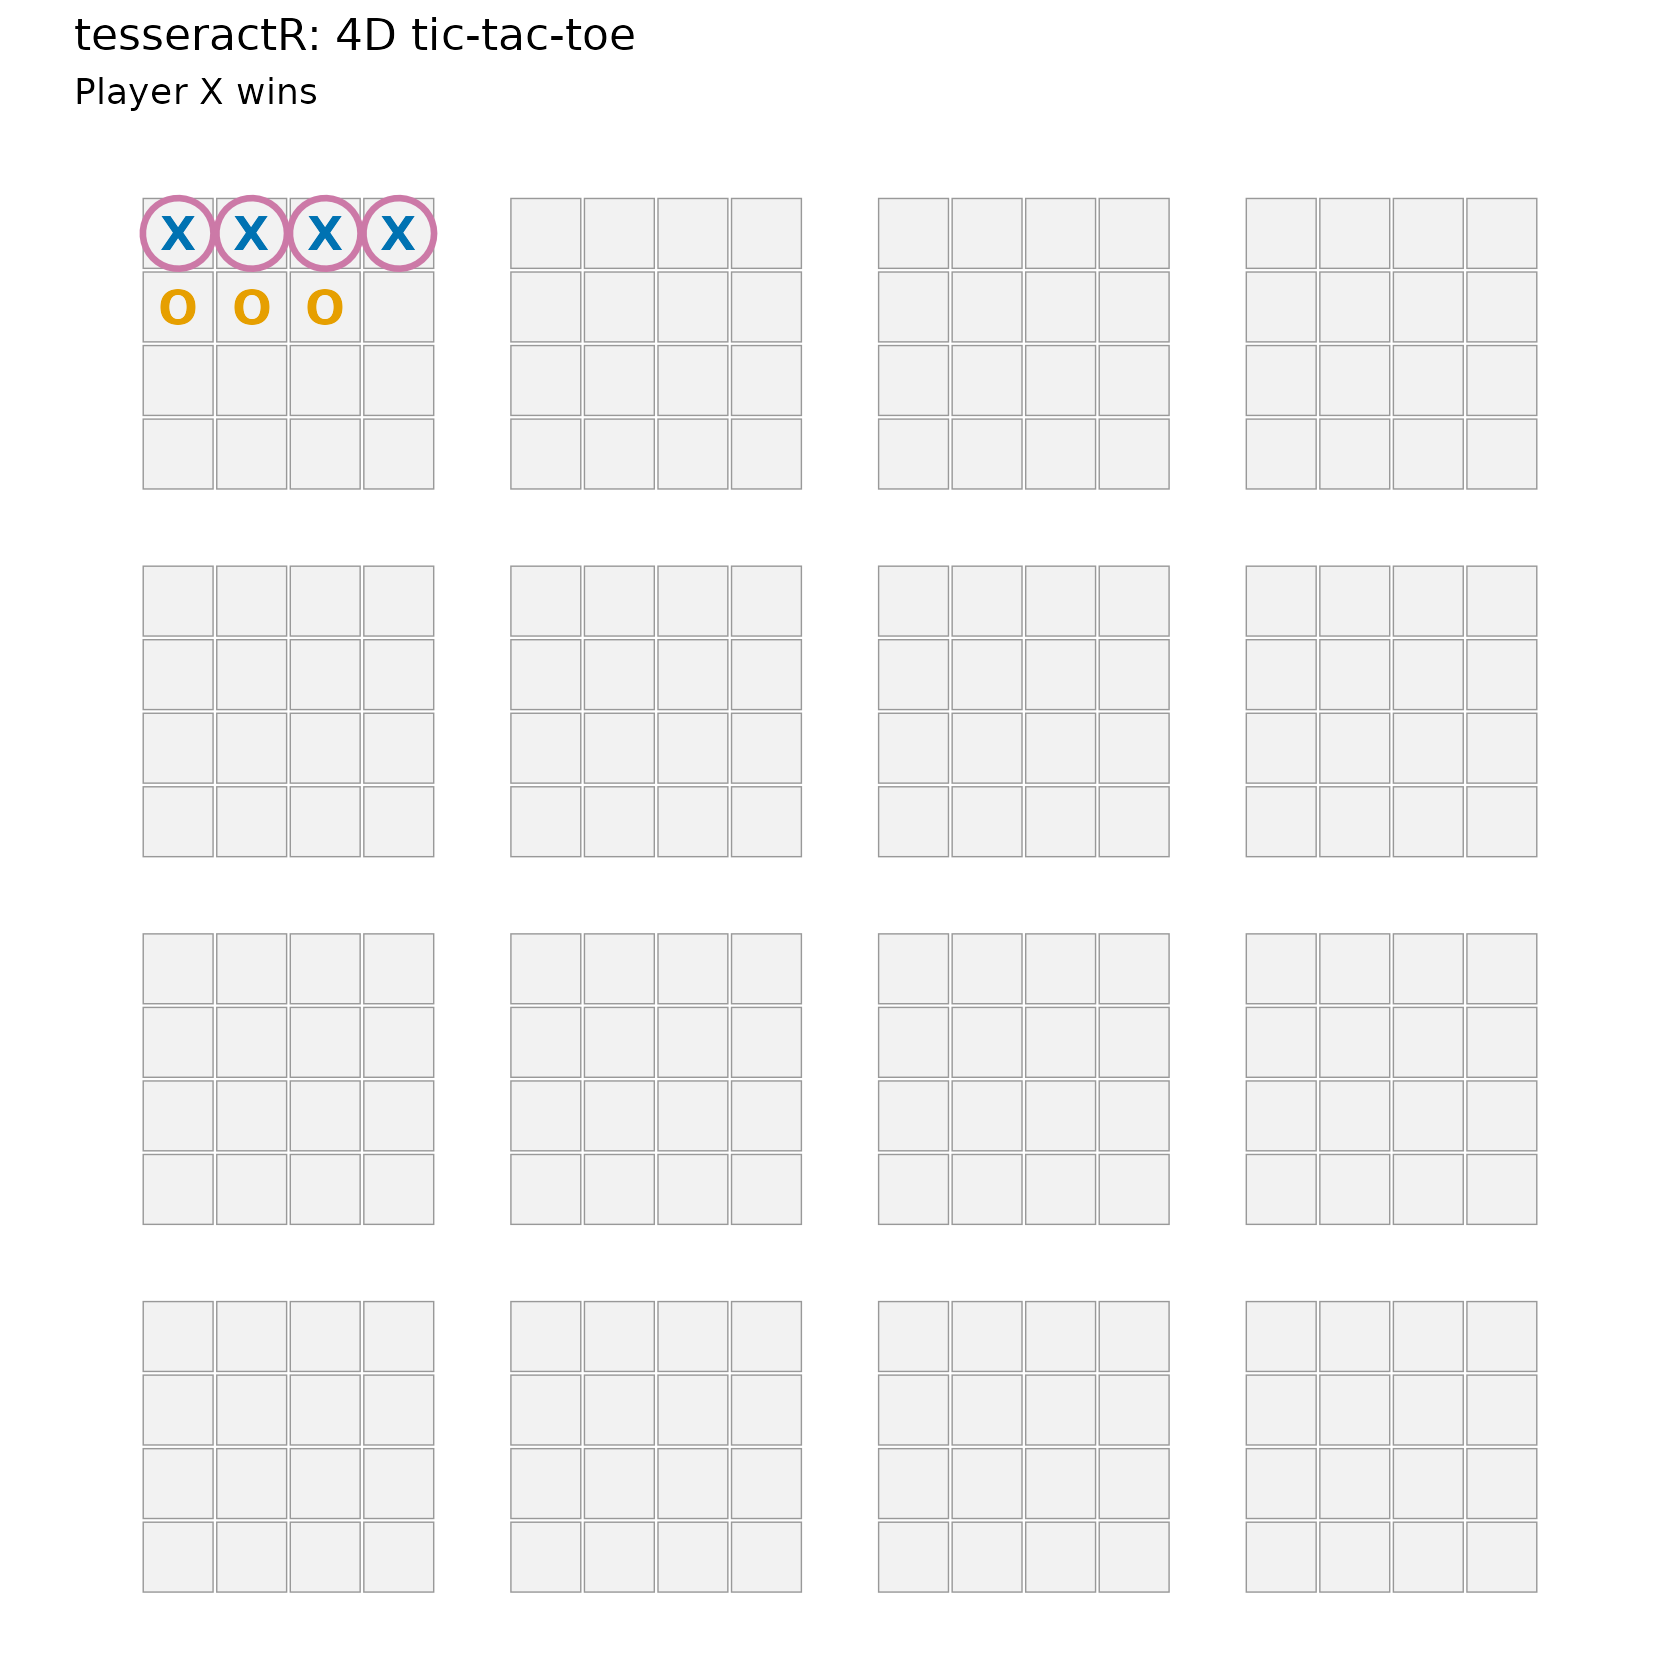
The four X’s sit in the top-left little board (that
is the k = 0, l = 0 board), along its top row
(j = 0), as i runs 0 → 3. The
pink rings mark exactly those four cells.
Where lines hide
Most winning lines are not a tidy row inside one board —
they jump between boards. To make those read as straight lines,
tsr_plot_slice() fixes one axis and shows the resulting 3D
cube as a strip of four boards. We return to this in Seeing in four dimensions; for now,
just note that the same board can be sliced four different ways:
tsr_plot_slice(b, axis = "l", at = 0)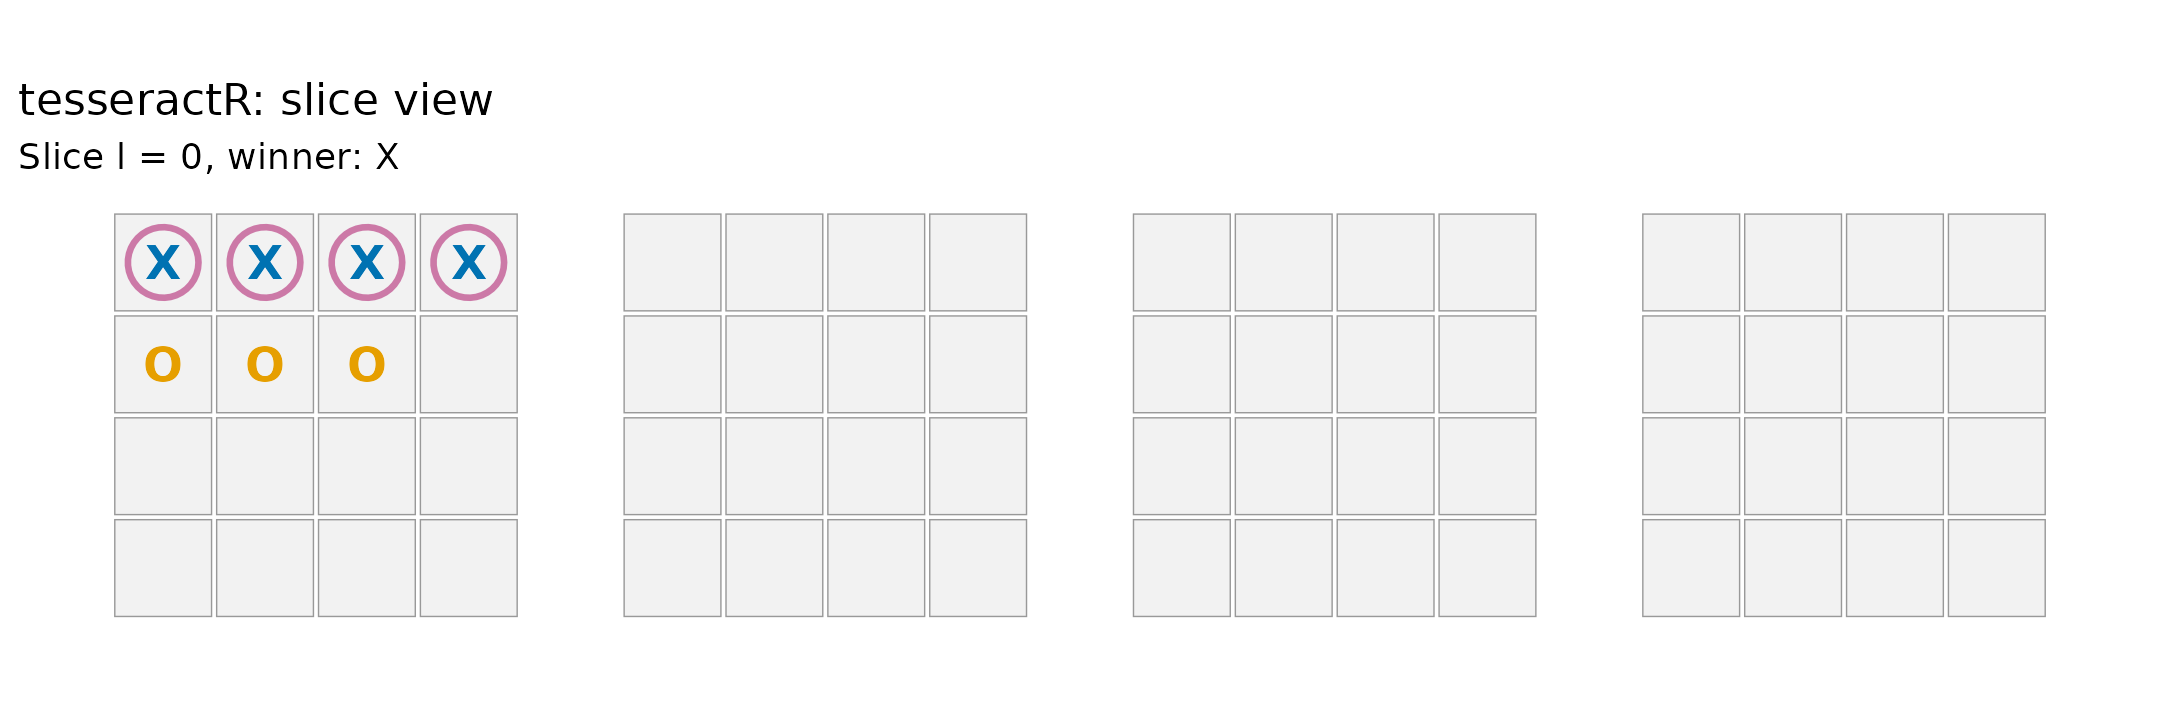
Recap
- 256 cells, coordinates
(i, j, k, l)in0:3; cell index1 + i + 4j + 16k + 64l. - X moves first; four in a line wins; there are 520 winning lines.
-
tsr_plot()shows the full board,tsr_plot_slice()shows one 3D slice.
Next: Playing in the app »