Tutorial page 2 of 4. Previous: « The rules · Next: Seeing in four dimensions »
The fastest way to feel four-dimensional tic-tac-toe is to play it. The package ships an interactive Shiny app. Install the package, then launch it with one call:
library(tesseractR)
tsr_run_app()              # opens in your browser
tsr_run_app(difficulty = 3) # start against a stronger AI
The screenshots below were captured from that app.
The layout at a glance
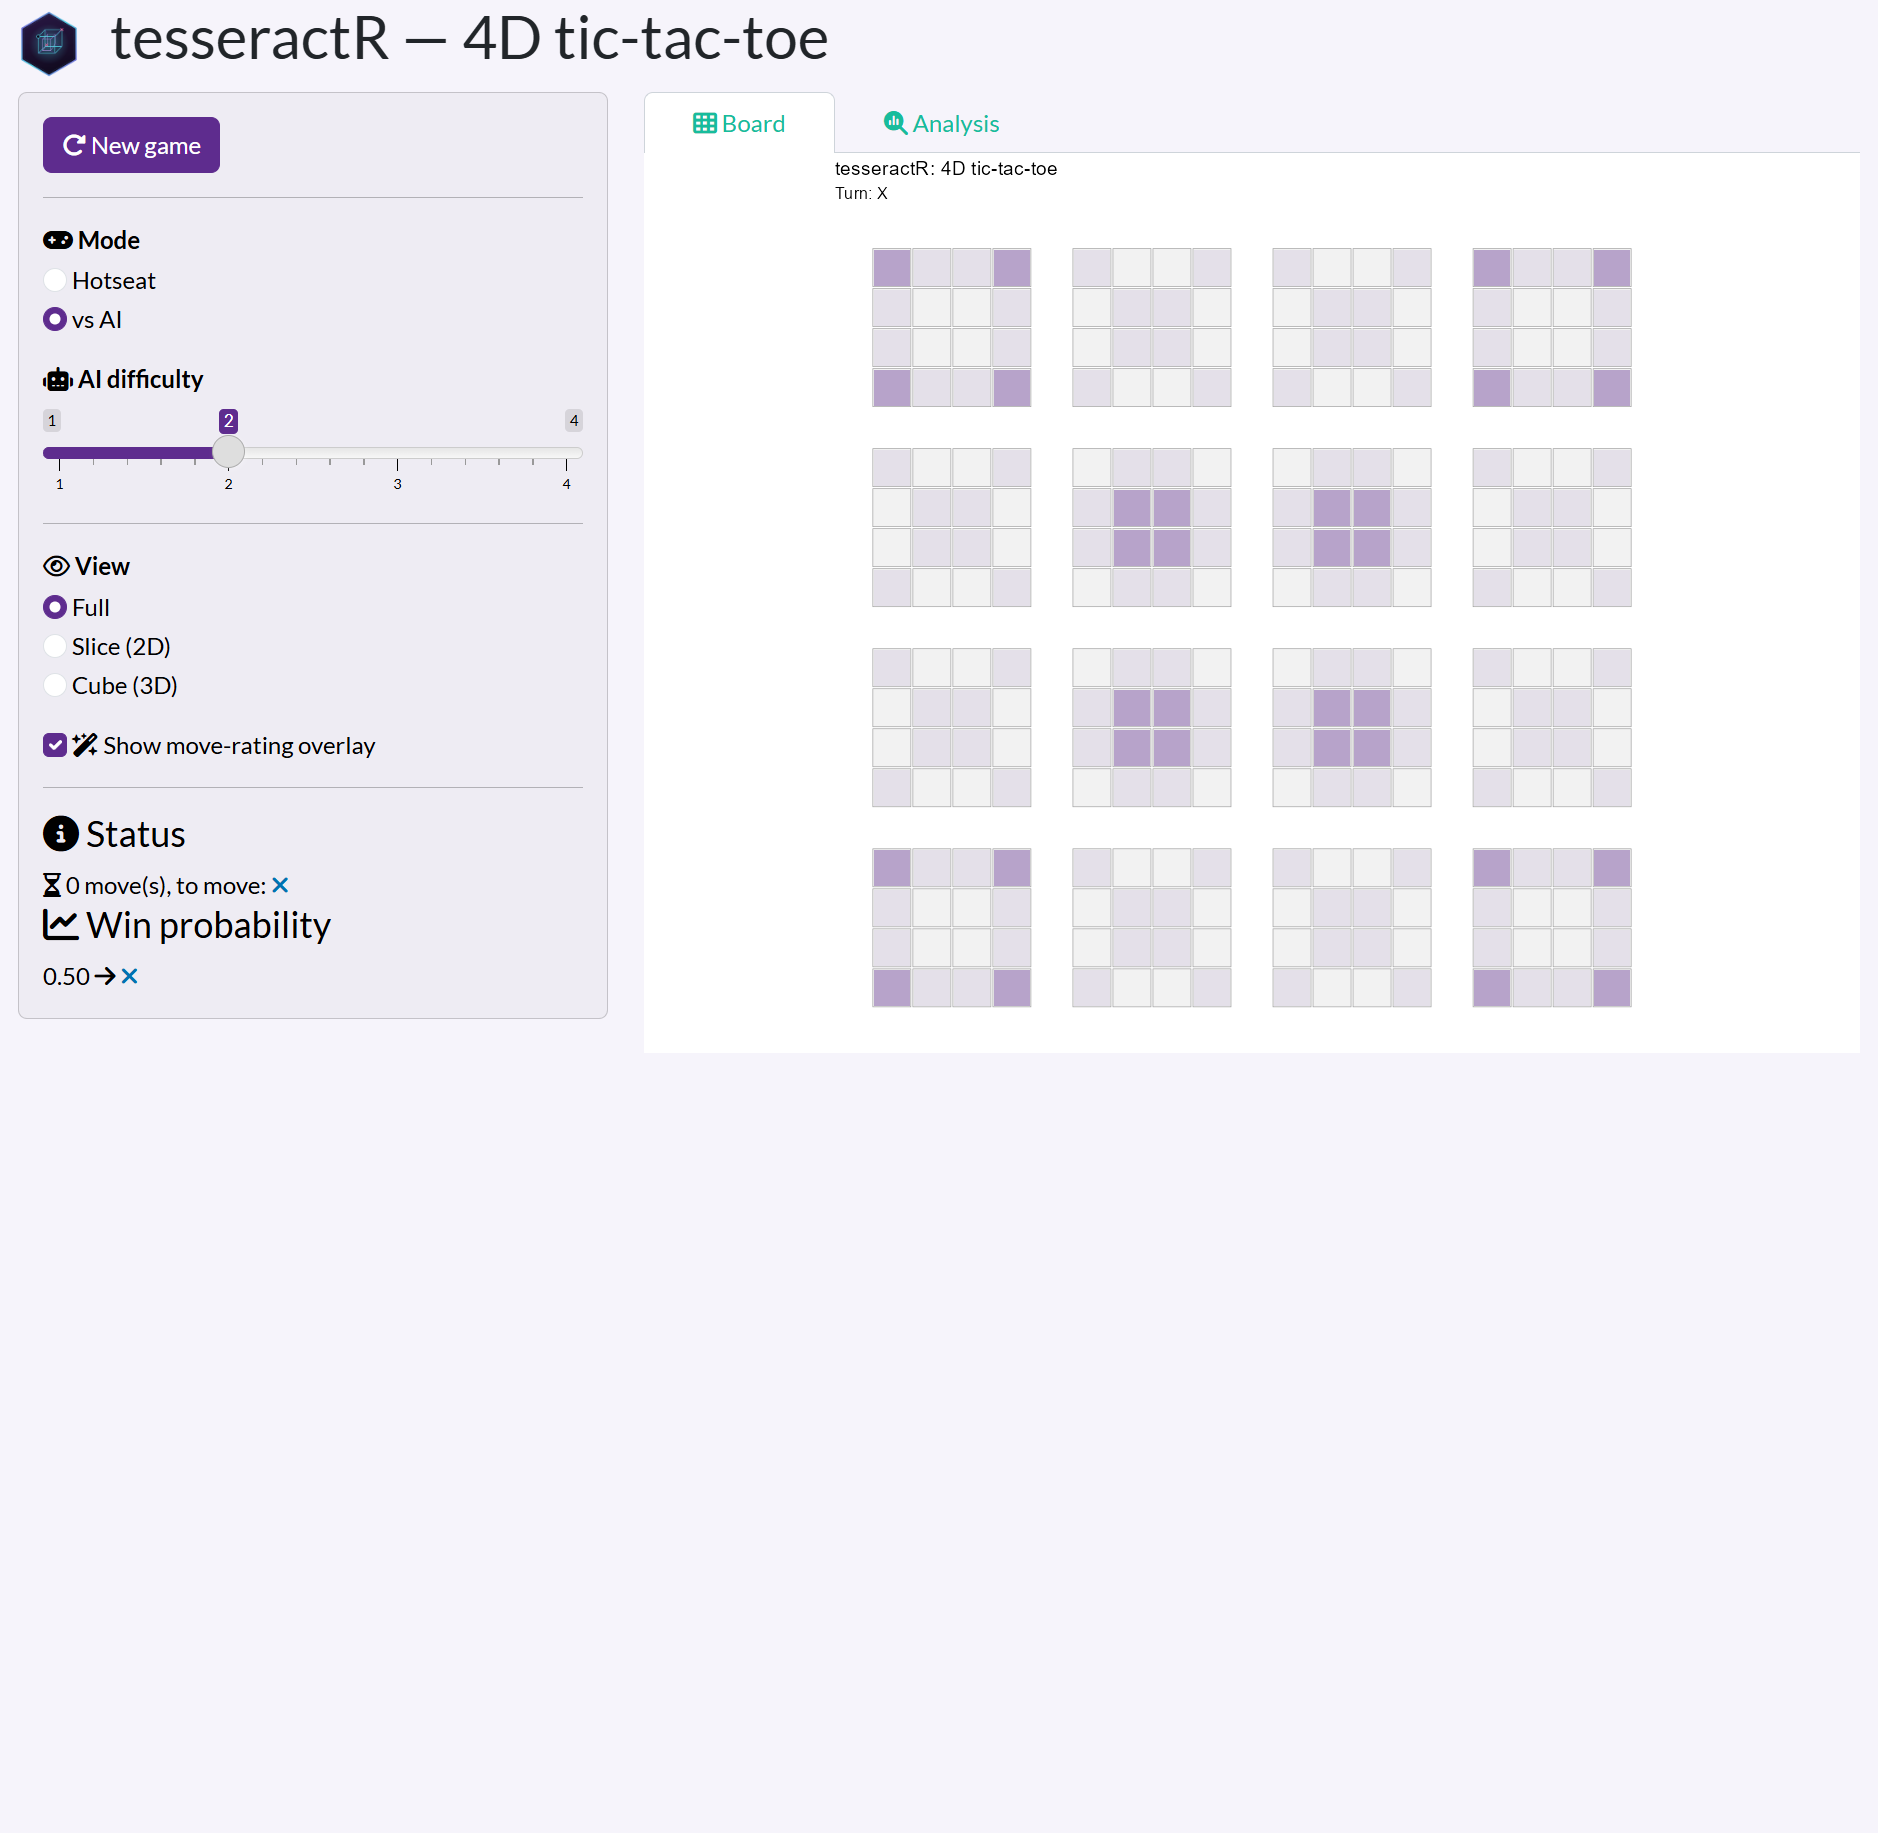
The window has two halves:
- Left — the control sidebar. New game, the playing Mode, the AI difficulty, the board View, the move-rating overlay toggle, and a live Status / Win probability read-out.
- Right — the board, with two tabs: Board (where you play) and Analysis (a post-game breakdown).
On an empty board the faint purple shading is the move-rating overlay — darker cells are stronger opening moves. More on that below.
Choosing how to play
- Mode — Hotseat (two humans taking turns on one screen) or vs AI.
- AI difficulty — a slider from 1 to 4. It sets how deep the negamax opponent searches: 1 is a quick, shallow opponent; 4 looks several moves ahead and is noticeably tougher.
Making a move is just a click on any empty cell in the Full view. In vs AI mode the computer replies immediately, so the move count jumps by two each time you play.
Three ways to see the board
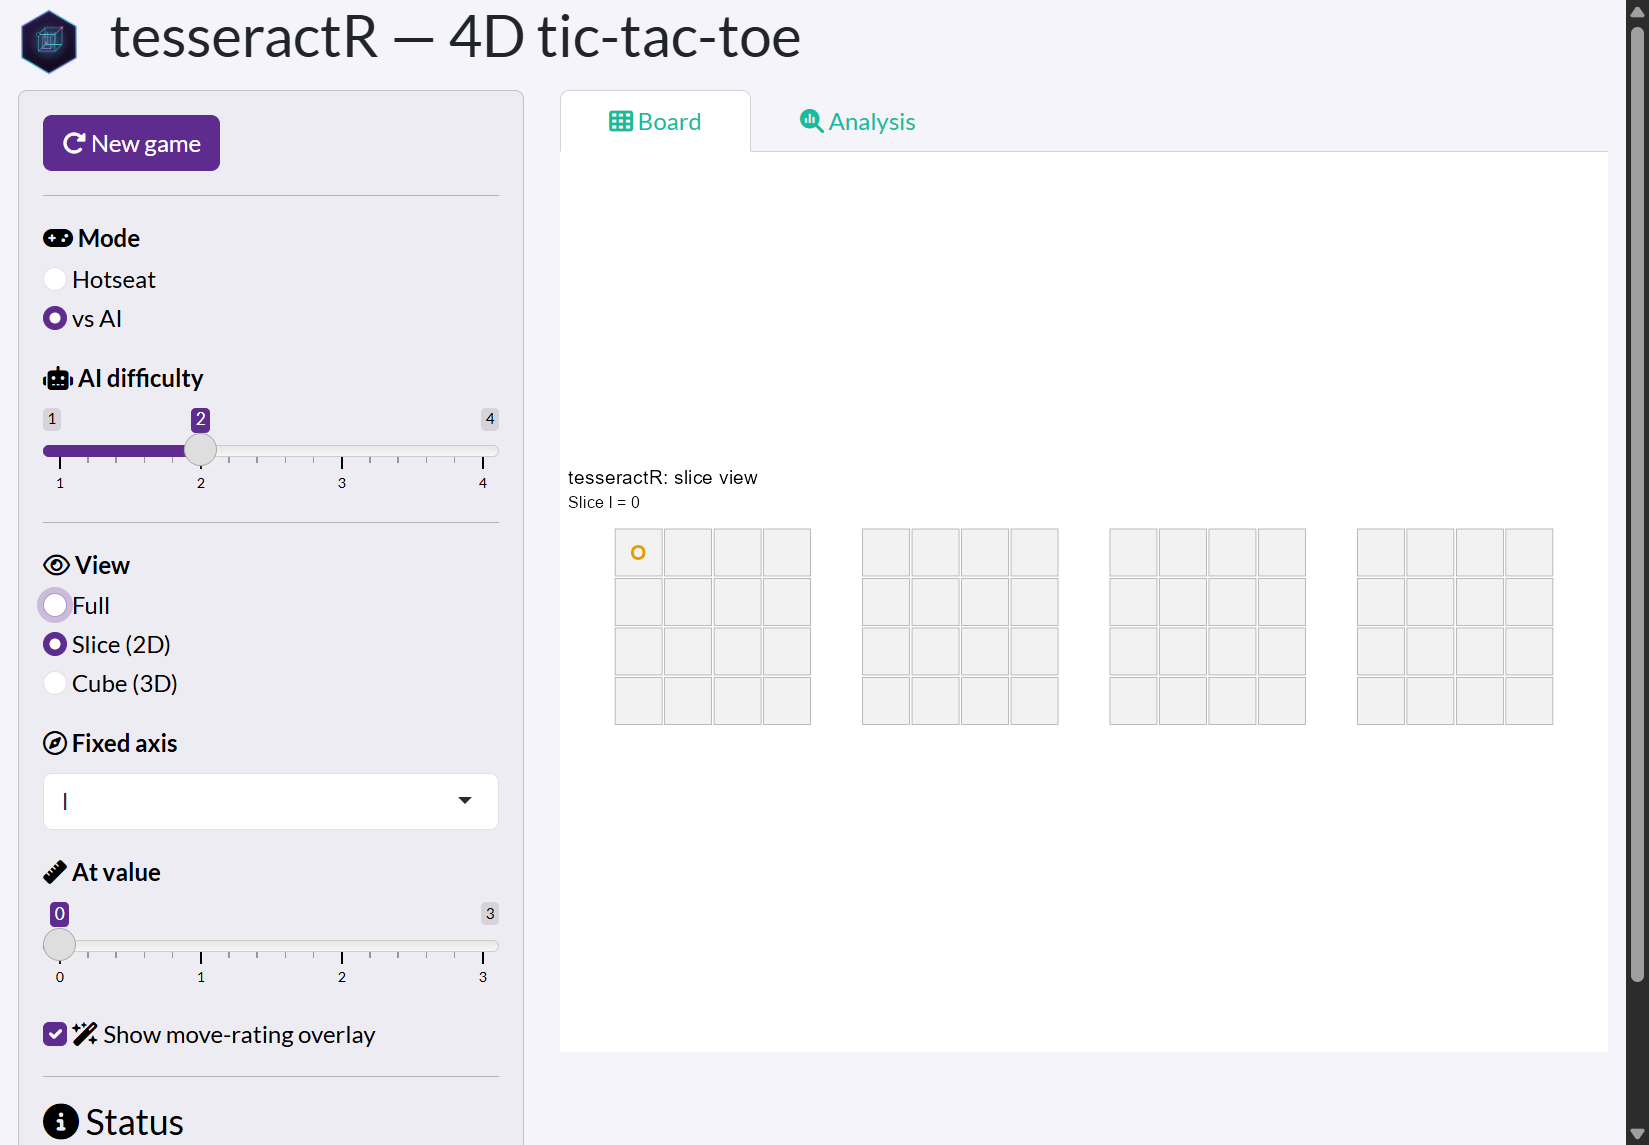
The View control switches between three representations of the same position. Pick whichever makes the lines you care about easiest to see.
Full
The default: all 256 cells at once, as a 4×4 grid of little boards. Here is a game a few moves in, with X (blue) and O (orange) both on the board:
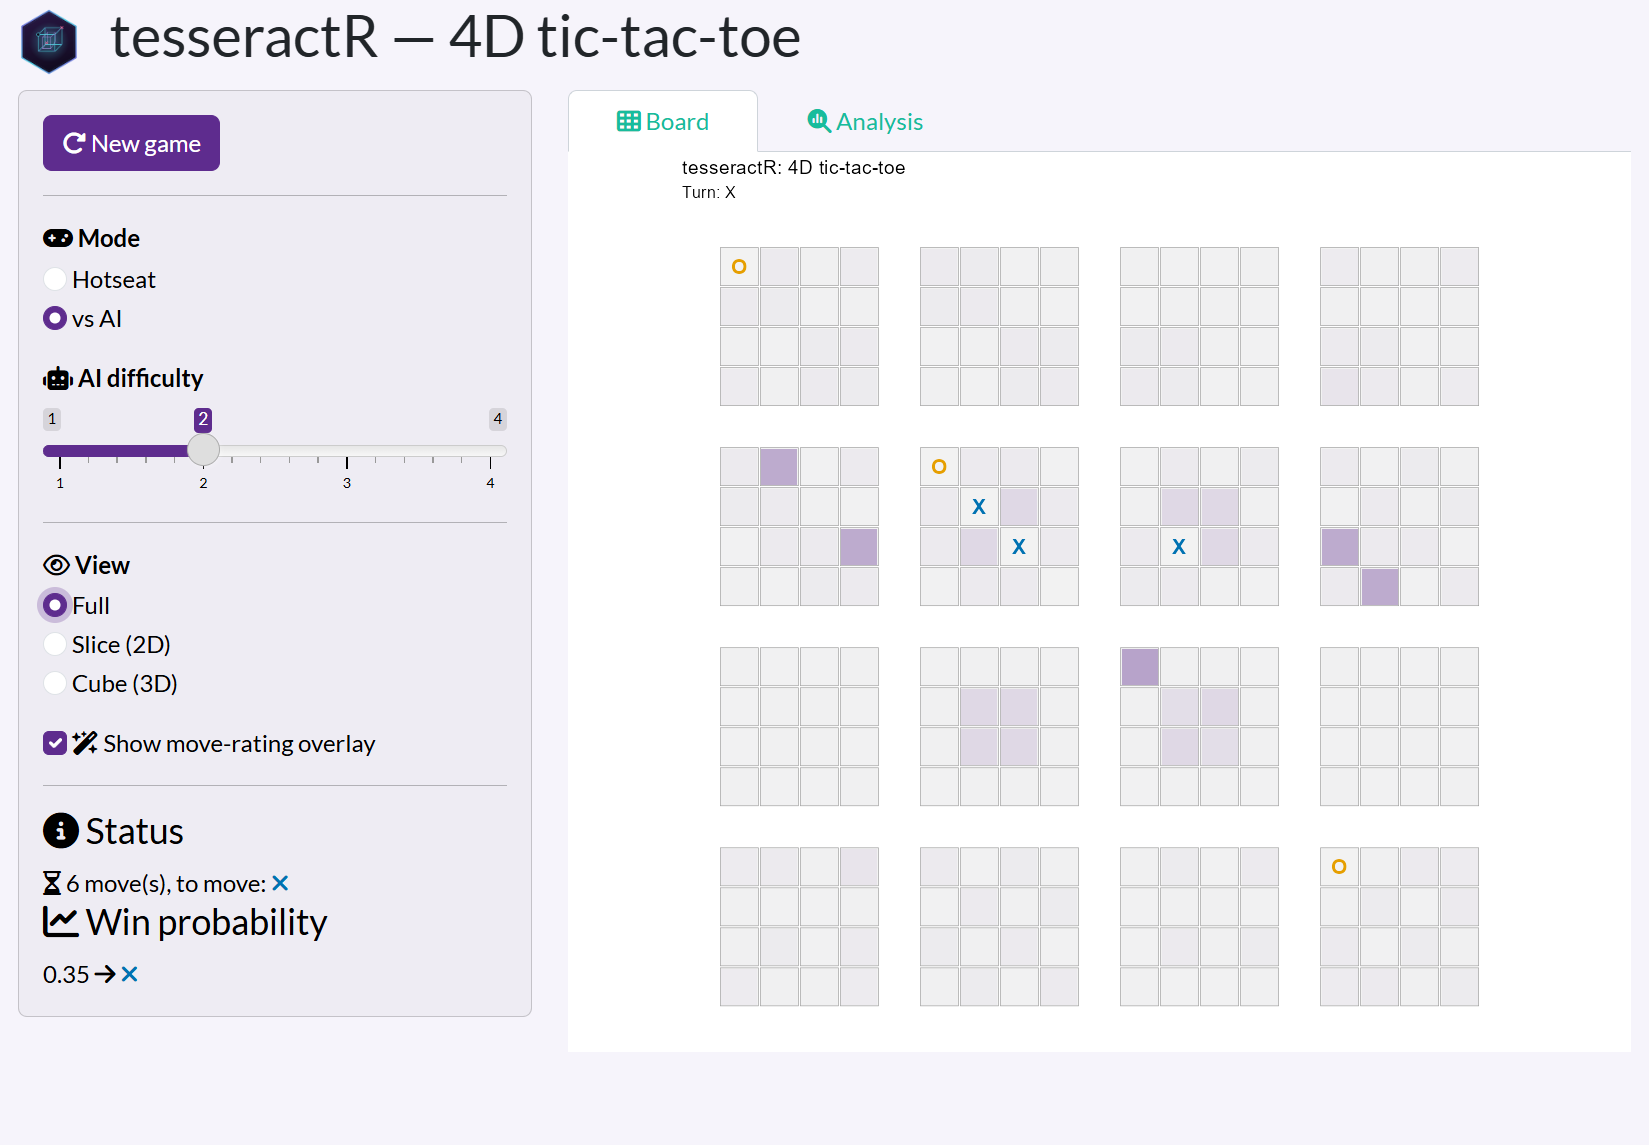
Notice the Status line — 6 moves, to move: X — and the win probability, 0.35, both updating as you play.
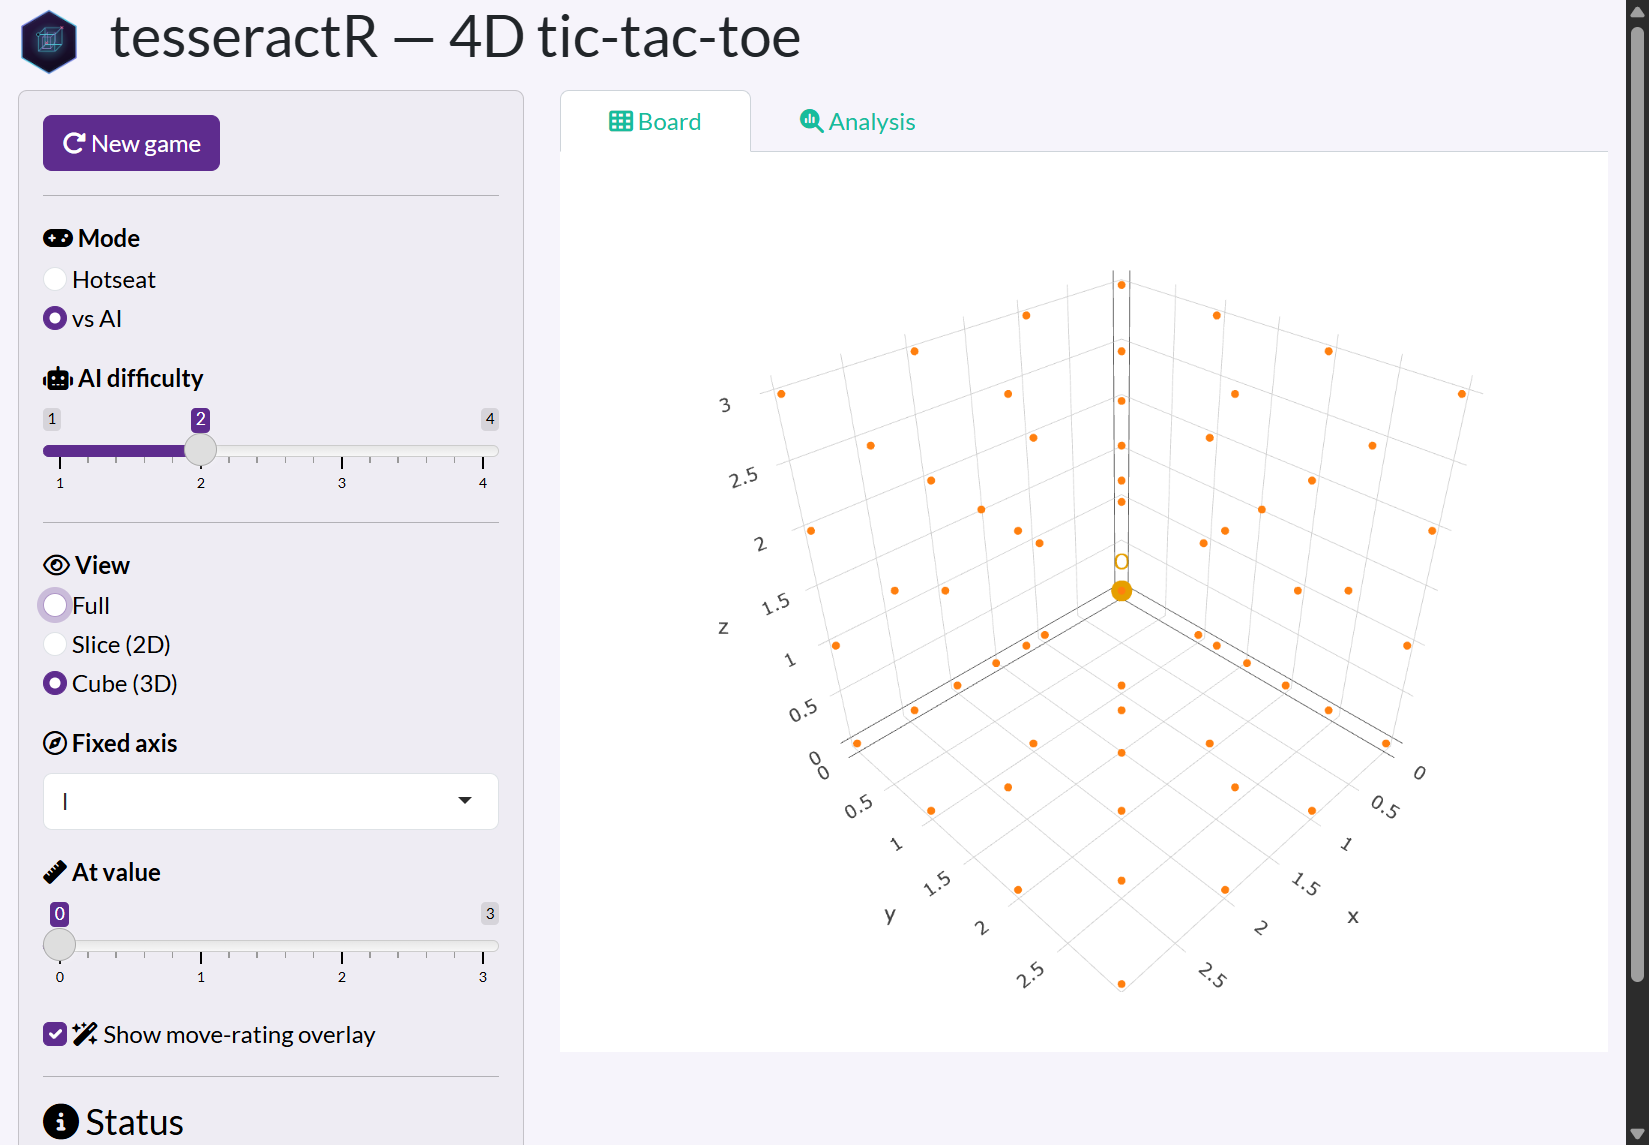
The move-rating overlay
With Show move-rating overlay ticked, every empty
cell is shaded by how good a move it would be for the player to move —
darker is better. It is the same information
tsr_rate_moves() returns from the console (see Playing from the R console), drawn straight
onto the board. Use it as a hint when you are learning, or switch it off
for a pure game.
The Win probability read-out in the sidebar is the matching single number: the model’s estimate that the side to move will win.
Winning
When someone completes a line, the game ends, the four winning cells are ringed in pink, and the Status switches to a trophy with the winner:
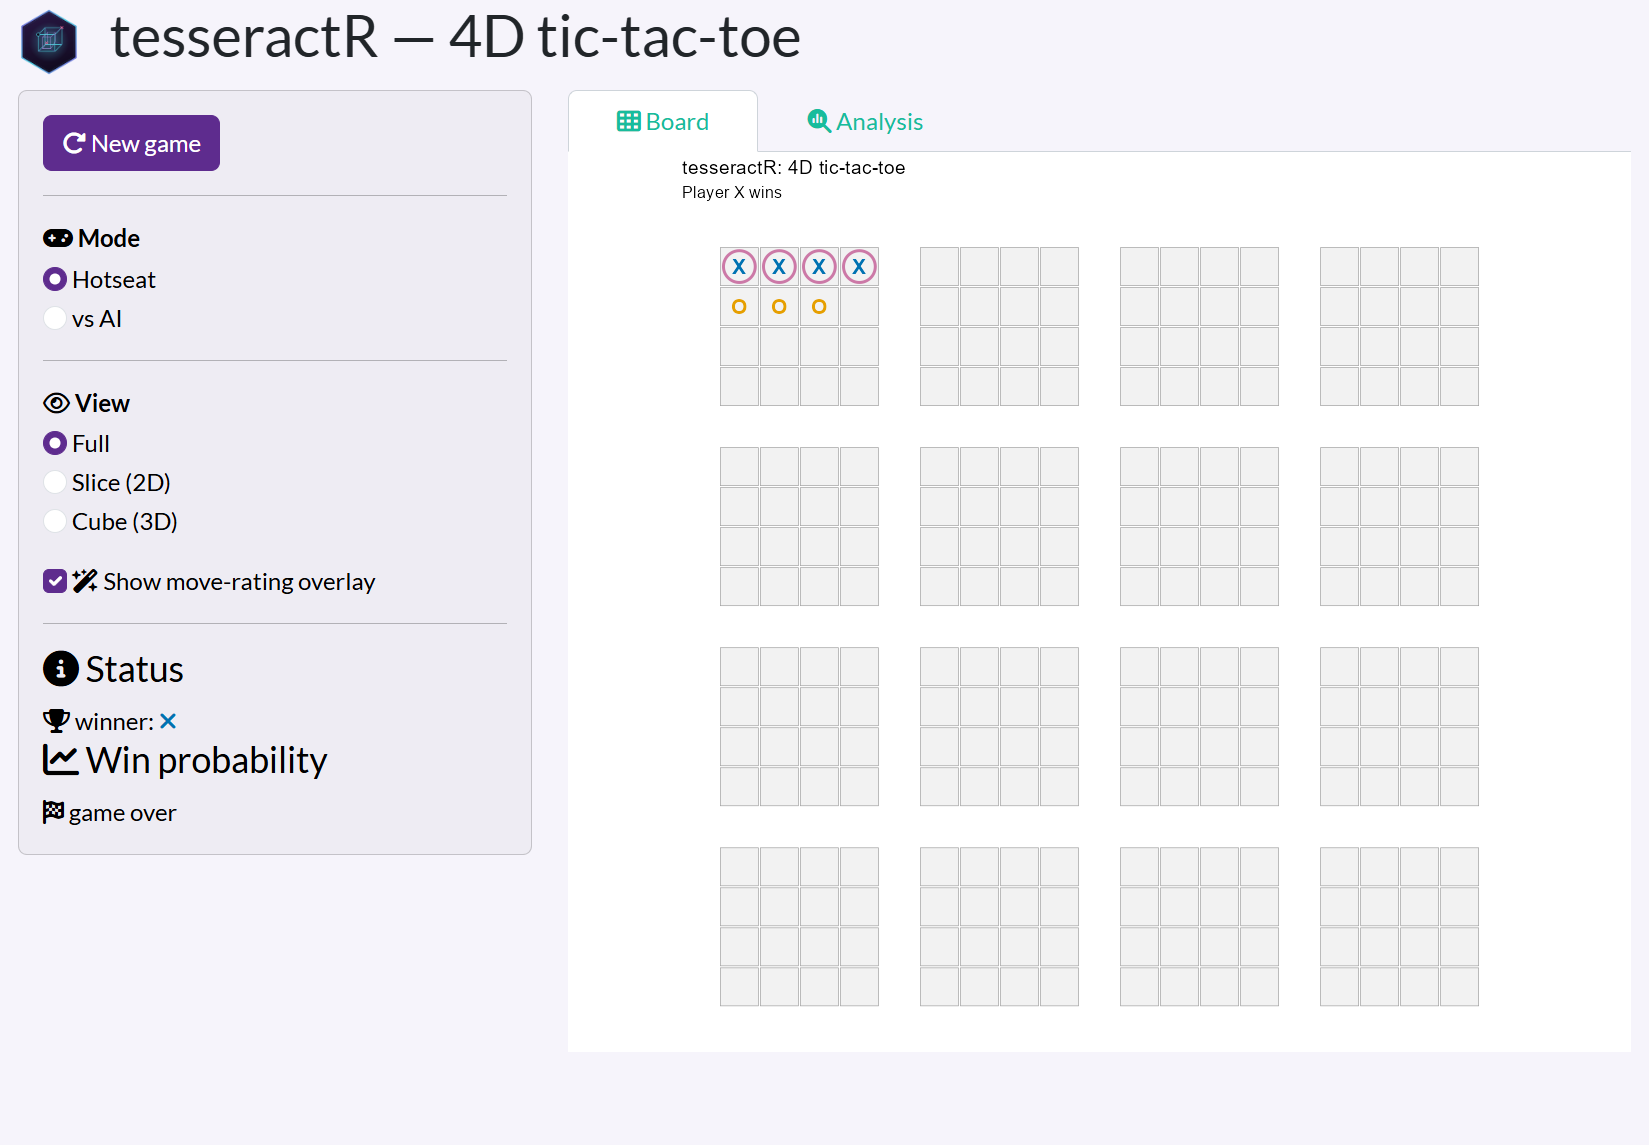
Press New game to start over (keeping your current mode and difficulty).
The Analysis tab
After a game with a few moves, open the Analysis tab for a post-mortem:
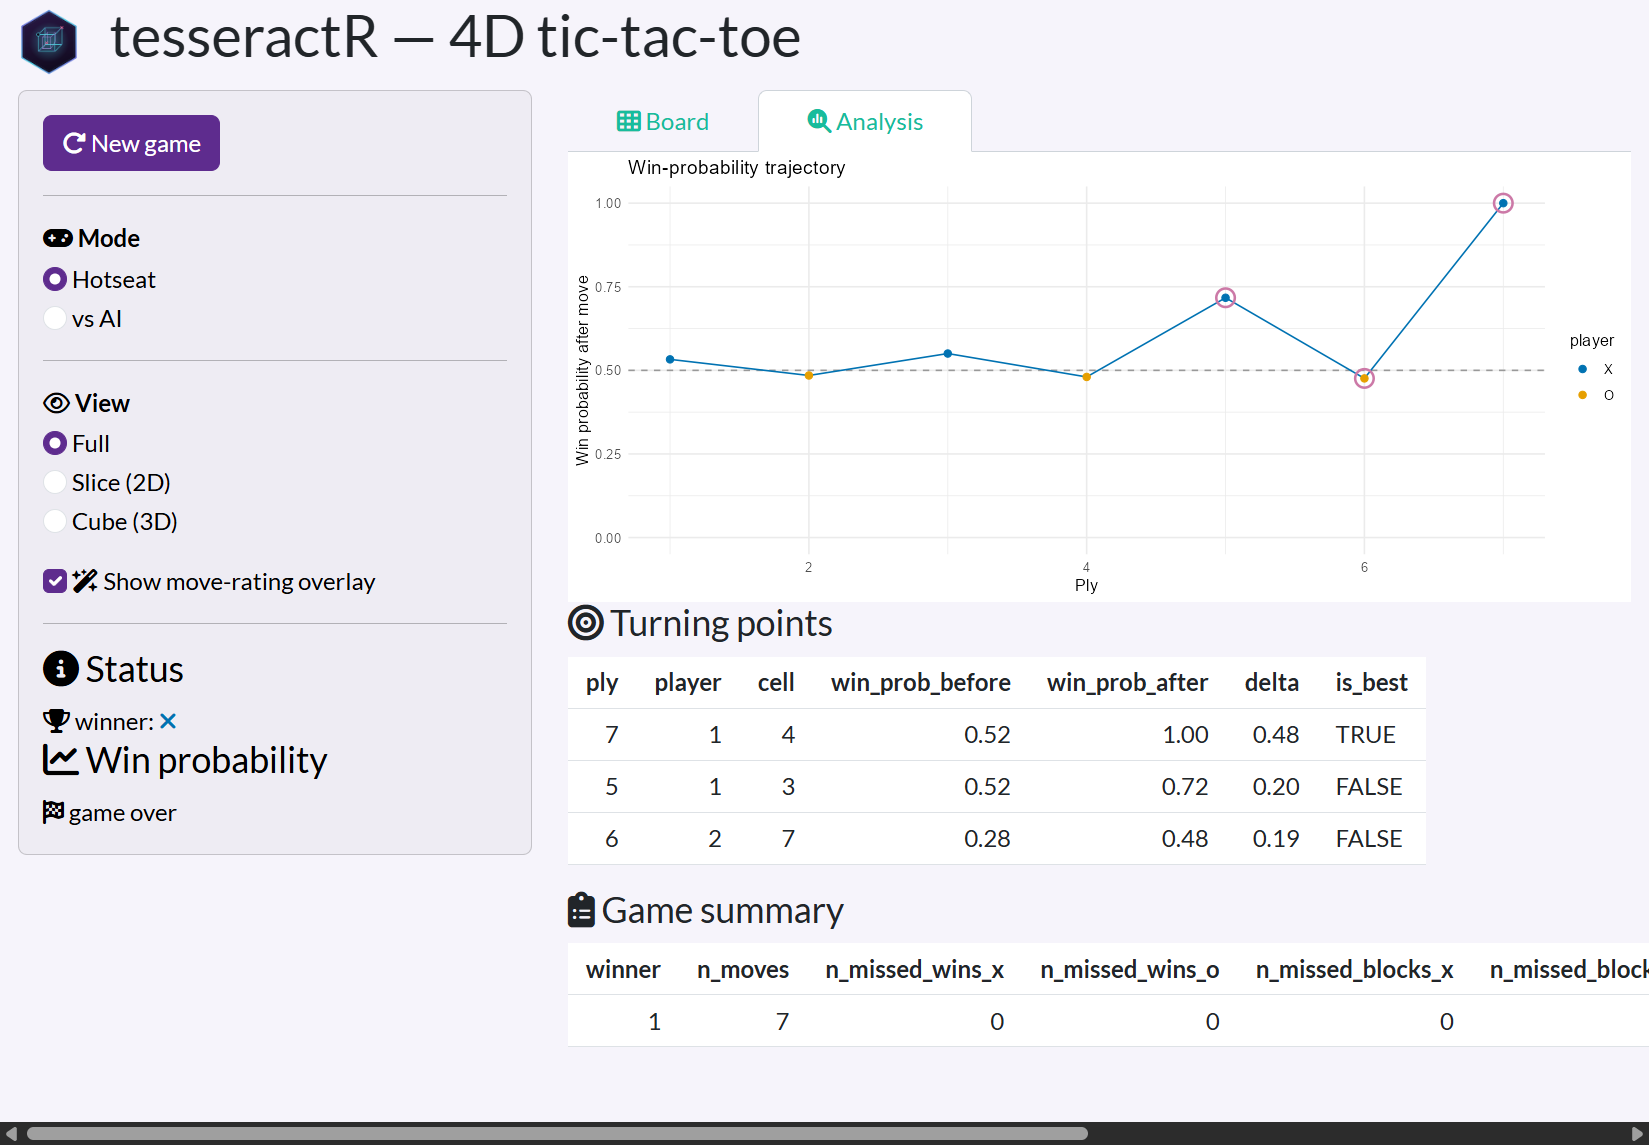
- Win-probability trajectory — how the position swung move by move. Each point is coloured by who moved; circled points are the biggest swings.
- Turning points — the plies where the win probability moved the most, with the before/after values and whether the move was the best available.
- Game summary — totals: missed wins, missed blocks, and overall decisiveness.
The same numbers are available programmatically with
tsr_analyze_game(), tsr_turning_points(), and
tsr_game_summary() — see the Simulation and Game Analysis article.