---
title: "Algorithmic Fairness as a Multi-Stakeholder Game"
description: "Modelling the tension between accuracy, fairness, and regulation as a strategic interaction — implementing fairness criteria, demonstrating impossibility results, and computing Pareto frontiers of accuracy vs fairness."
author: "Raban Heller"
date: 2026-05-08
date-modified: 2026-05-08
categories:
- ethics-applications
- algorithmic-fairness
- multi-stakeholder-games
keywords: ["algorithmic fairness", "impossibility theorem", "demographic parity", "equalised odds", "Pareto frontier"]
labels: ["ethics", "fairness"]
tier: 1
bibliography: ../../../references.bib
vgwort: "TODO_VGWORT_ETHICS_ALGORITHMIC_FAIRNESS"
image: thumbnail.png
image-alt: "Pareto frontier showing the tradeoff between classifier accuracy and demographic parity gap"
citation:
type: webpage
url: https://r-heller.github.io/equilibria/tutorials/ethics-applications/algorithmic-fairness-game/
license: "CC BY-SA 4.0"
draft: false
has_static_fig: true
has_interactive_fig: true
has_shiny_app: false
---
```{r}
#| label: setup
#| include: false
library(ggplot2)
library(dplyr)
library(tidyr)
library(plotly)
okabe_ito <- c("#E69F00", "#56B4E9", "#009E73", "#F0E442",
"#0072B2", "#D55E00", "#CC79A7", "#999999")
theme_publication <- function(base_size = 12) {
theme_minimal(base_size = base_size) +
theme(plot.title = element_text(size = base_size * 1.2, face = "bold"),
plot.subtitle = element_text(size = base_size * 0.9, color = "grey40"),
axis.line = element_line(color = "grey30", linewidth = 0.3),
panel.grid.minor = element_blank(), legend.position = "bottom",
plot.margin = margin(10, 10, 10, 10))
}
```
## Introduction & motivation
Algorithmic decision-making systems increasingly shape consequential outcomes in people's lives: who gets a loan, who is flagged for additional screening, who receives a job interview, and who is granted parole. As these systems proliferate, a fundamental tension has emerged between the pursuit of predictive accuracy and the imperative of fairness across demographic groups. This tension is not merely technical — it is deeply strategic. Multiple stakeholders with conflicting objectives interact around the design and deployment of these systems, and their strategic behaviour shapes which algorithms are adopted and how they affect different populations.
Consider the key players in this strategic landscape. The **platform** (or firm, or algorithm designer) seeks to deploy a classifier that maximises predictive accuracy, because accuracy drives business value — better credit scoring means fewer defaults, better hiring algorithms mean more productive employees. The **users** — individuals subject to algorithmic decisions — care about being treated fairly. But "fairly" means different things to different people and different groups. Members of a historically disadvantaged group may demand that the algorithm's positive prediction rate be equal across groups (demographic parity), while members of the advantaged group may argue that prediction rates should reflect underlying differences in base rates (calibration). The **regulator** must navigate these competing demands, choosing which fairness standard to enforce and how strictly to enforce it.
This multi-stakeholder tension becomes even more fraught in light of a remarkable impossibility result established independently by Chouldechova (2017) and Kleinberg, Mullainathan, and Raghavan (2016). They proved that when the base rates of the positive outcome differ between demographic groups — as they often do in practice — it is mathematically impossible for any non-trivial classifier to simultaneously satisfy three natural fairness criteria: demographic parity (equal positive prediction rates), equalised odds (equal true positive and false positive rates), and calibration (equal precision across groups). This is not a limitation of any particular algorithm; it is a mathematical constraint inherent to the problem structure. Any improvement in one fairness measure necessarily comes at the cost of another, and typically at the cost of overall accuracy as well.
Game theory provides the natural framework for analysing this situation. Each stakeholder's choice — the platform's choice of classification threshold, the regulator's choice of fairness standard, and the affected groups' choice of whether to contest or accept the outcome — constitutes a strategic interaction. The impossibility theorem means that no outcome can fully satisfy all parties, making the question of how to resolve the conflict inherently strategic. By modelling this as a game, we can identify Pareto-efficient compromises: configurations where no stakeholder can be made better off without making another worse off. This Pareto analysis provides a principled way to navigate the tradeoff space, making the costs and benefits of different fairness-accuracy combinations explicit and transparent.
In this tutorial, we implement a simple binary classifier on synthetic data with two demographic groups that have different base rates. We compute the classifier's performance under different thresholds, measuring accuracy alongside three fairness criteria. We demonstrate the impossibility theorem empirically by showing that no single threshold equalises all three fairness measures simultaneously. We then frame the choice of threshold as a game between the platform (maximising accuracy), users from the disadvantaged group (minimising the fairness gap), and a regulator (minimising a weighted combination), and we compute the Pareto frontier of achievable outcomes. The result is a concrete, computational demonstration of how game-theoretic thinking illuminates the algorithmic fairness debate.
## Mathematical formulation
### Binary classification setup
Let $Y \in \{0, 1\}$ be the true outcome and $\hat{Y} \in \{0, 1\}$ be the classifier's prediction. Let $G \in \{A, B\}$ denote group membership. The classifier uses a score $S \in [0, 1]$ and a threshold $t$: $\hat{Y} = \mathbb{1}[S \geq t]$.
### Fairness criteria
**Demographic parity (DP)**: Equal positive prediction rates across groups:
$$
\text{DP gap} = |P(\hat{Y} = 1 \mid G = A) - P(\hat{Y} = 1 \mid G = B)|
$$
**Equalised odds (EO)**: Equal true positive rates (TPR) and false positive rates (FPR) across groups:
$$
\text{EO gap} = \frac{1}{2}\left(|\text{TPR}_A - \text{TPR}_B| + |\text{FPR}_A - \text{FPR}_B|\right)
$$
**Calibration (CAL)**: Equal precision (positive predictive value) across groups:
$$
\text{CAL gap} = |P(Y = 1 \mid \hat{Y} = 1, G = A) - P(Y = 1 \mid \hat{Y} = 1, G = B)|
$$
### Impossibility theorem
**Theorem (Chouldechova, 2017; Kleinberg-Mullainathan-Raghavan, 2016):** If the base rates differ, $P(Y=1|G=A) \neq P(Y=1|G=B)$, and the classifier is not a perfect predictor, then DP gap = 0, EO gap = 0, and CAL gap = 0 cannot all hold simultaneously.
### Multi-stakeholder game
Define three players with utility functions depending on threshold $t$:
- **Platform**: $u_P(t) = \text{Accuracy}(t)$
- **Disadvantaged group**: $u_D(t) = -\text{DP gap}(t)$
- **Regulator**: $u_R(t) = \text{Accuracy}(t) - \lambda \cdot \text{DP gap}(t)$ for some weight $\lambda > 0$
A **Pareto-efficient** threshold $t^*$ is one where no alternative threshold improves one player's utility without reducing another's.
## R implementation
```{r}
#| label: implementation
set.seed(2026)

# --- Generate synthetic data with two groups ---
n <- 5000
group <- sample(c("A", "B"), n, replace = TRUE, prob = c(0.5, 0.5))

# Different base rates: Group A has higher positive rate
base_rate_A <- 0.4
base_rate_B <- 0.2

y <- ifelse(group == "A",
            rbinom(n, 1, base_rate_A),
            rbinom(n, 1, base_rate_B))

# Generate scores (imperfect classifier)
# Score = true label + noise, clipped to [0, 1]
noise <- rnorm(n, 0, 0.35)
score <- pmin(pmax(y + noise, 0), 1)
# Add slight group-dependent bias
score <- ifelse(group == "A", score + 0.05, score - 0.05)
score <- pmin(pmax(score, 0), 1)

df <- data.frame(group = group, y = y, score = score)

cat("Base rates:\n")
cat(" Group A:", round(mean(df$y[df$group == "A"]), 3), "\n")
cat(" Group B:", round(mean(df$y[df$group == "B"]), 3), "\n")
cat(" Overall:", round(mean(df$y), 3), "\n\n")
# --- Compute fairness metrics across thresholds ---
thresholds <- seq(0.05, 0.95, by = 0.01)

compute_metrics <- function(df, threshold) {
  df$yhat <- as.integer(df$score >= threshold)

  # Overall accuracy
  accuracy <- mean(df$y == df$yhat)

  # Group-specific metrics
  metrics_by_group <- df |>
    group_by(group) |>
    summarise(
      pos_rate = mean(yhat),
      tpr = sum(yhat == 1 & y == 1) / max(sum(y == 1), 1),
      fpr = sum(yhat == 1 & y == 0) / max(sum(y == 0), 1),
      precision = ifelse(sum(yhat == 1) > 0,
                         sum(yhat == 1 & y == 1) / sum(yhat == 1), NA),
      .groups = "drop"
    )

  a_metrics <- metrics_by_group |> filter(group == "A")
  b_metrics <- metrics_by_group |> filter(group == "B")

  dp_gap <- abs(a_metrics$pos_rate - b_metrics$pos_rate)
  eo_gap <- 0.5 * (abs(a_metrics$tpr - b_metrics$tpr) +
                      abs(a_metrics$fpr - b_metrics$fpr))

  prec_a <- ifelse(is.na(a_metrics$precision), 0, a_metrics$precision)
  prec_b <- ifelse(is.na(b_metrics$precision), 0, b_metrics$precision)
  cal_gap <- abs(prec_a - prec_b)

  data.frame(
    threshold = threshold,
    accuracy = accuracy,
    dp_gap = dp_gap,
    eo_gap = eo_gap,
    cal_gap = cal_gap,
    pos_rate_A = a_metrics$pos_rate,
    pos_rate_B = b_metrics$pos_rate
  )
}

results <- do.call(rbind, lapply(thresholds, function(t) compute_metrics(df, t)))

cat("Threshold with min DP gap:", results$threshold[which.min(results$dp_gap)],
    "(gap:", round(min(results$dp_gap), 4), ")\n")
cat("Threshold with min EO gap:", results$threshold[which.min(results$eo_gap)],
    "(gap:", round(min(results$eo_gap), 4), ")\n")
cat("Threshold with min CAL gap:", results$threshold[which.min(results$cal_gap)],
    "(gap:", round(min(results$cal_gap), 4), ")\n")
cat("Threshold with max accuracy:", results$threshold[which.max(results$accuracy)],
    "(accuracy:", round(max(results$accuracy), 4), ")\n\n")
# --- Demonstrate impossibility ---
# At the DP-minimising threshold
dp_best <- results[which.min(results$dp_gap), ]
cat("At DP-optimal threshold (", dp_best$threshold, "):\n")
cat(" DP gap:", round(dp_best$dp_gap, 4), "\n")
cat(" EO gap:", round(dp_best$eo_gap, 4), "\n")
cat(" CAL gap:", round(dp_best$cal_gap, 4), "\n")
cat(" Accuracy:", round(dp_best$accuracy, 4), "\n\n")
# --- Stakeholder utilities ---
lambda_reg <- 2.0  # regulator weight on fairness

results$u_platform <- results$accuracy
results$u_disadvantaged <- -results$dp_gap
results$u_regulator <- results$accuracy - lambda_reg * results$dp_gap

cat("Platform prefers threshold:",
    results$threshold[which.max(results$u_platform)], "\n")
cat("Disadvantaged group prefers threshold:",
    results$threshold[which.max(results$u_disadvantaged)], "\n")
cat("Regulator prefers threshold:",
    results$threshold[which.max(results$u_regulator)], "\n\n")
# --- Pareto frontier (accuracy vs DP gap) ---
pareto_front <- results |>
  arrange(dp_gap) |>
  mutate(is_pareto = {
    pareto <- logical(n())
    max_acc <- -Inf
    for (i in seq_len(n())) {
      if (accuracy[i] > max_acc) {
        pareto[i] <- TRUE
        max_acc <- accuracy[i]
      }
    }
    pareto
  }) |>
  filter(is_pareto)

cat("Pareto frontier contains", nrow(pareto_front), "points\n")
cat("Pareto range - Accuracy:", round(min(pareto_front$accuracy), 3),
    "to", round(max(pareto_front$accuracy), 3), "\n")
cat("Pareto range - DP gap:", round(min(pareto_front$dp_gap), 3),
    "to", round(max(pareto_front$dp_gap), 3), "\n")
```
## Static publication-ready figure
```{r}
#| label: fig-fairness-tradeoff
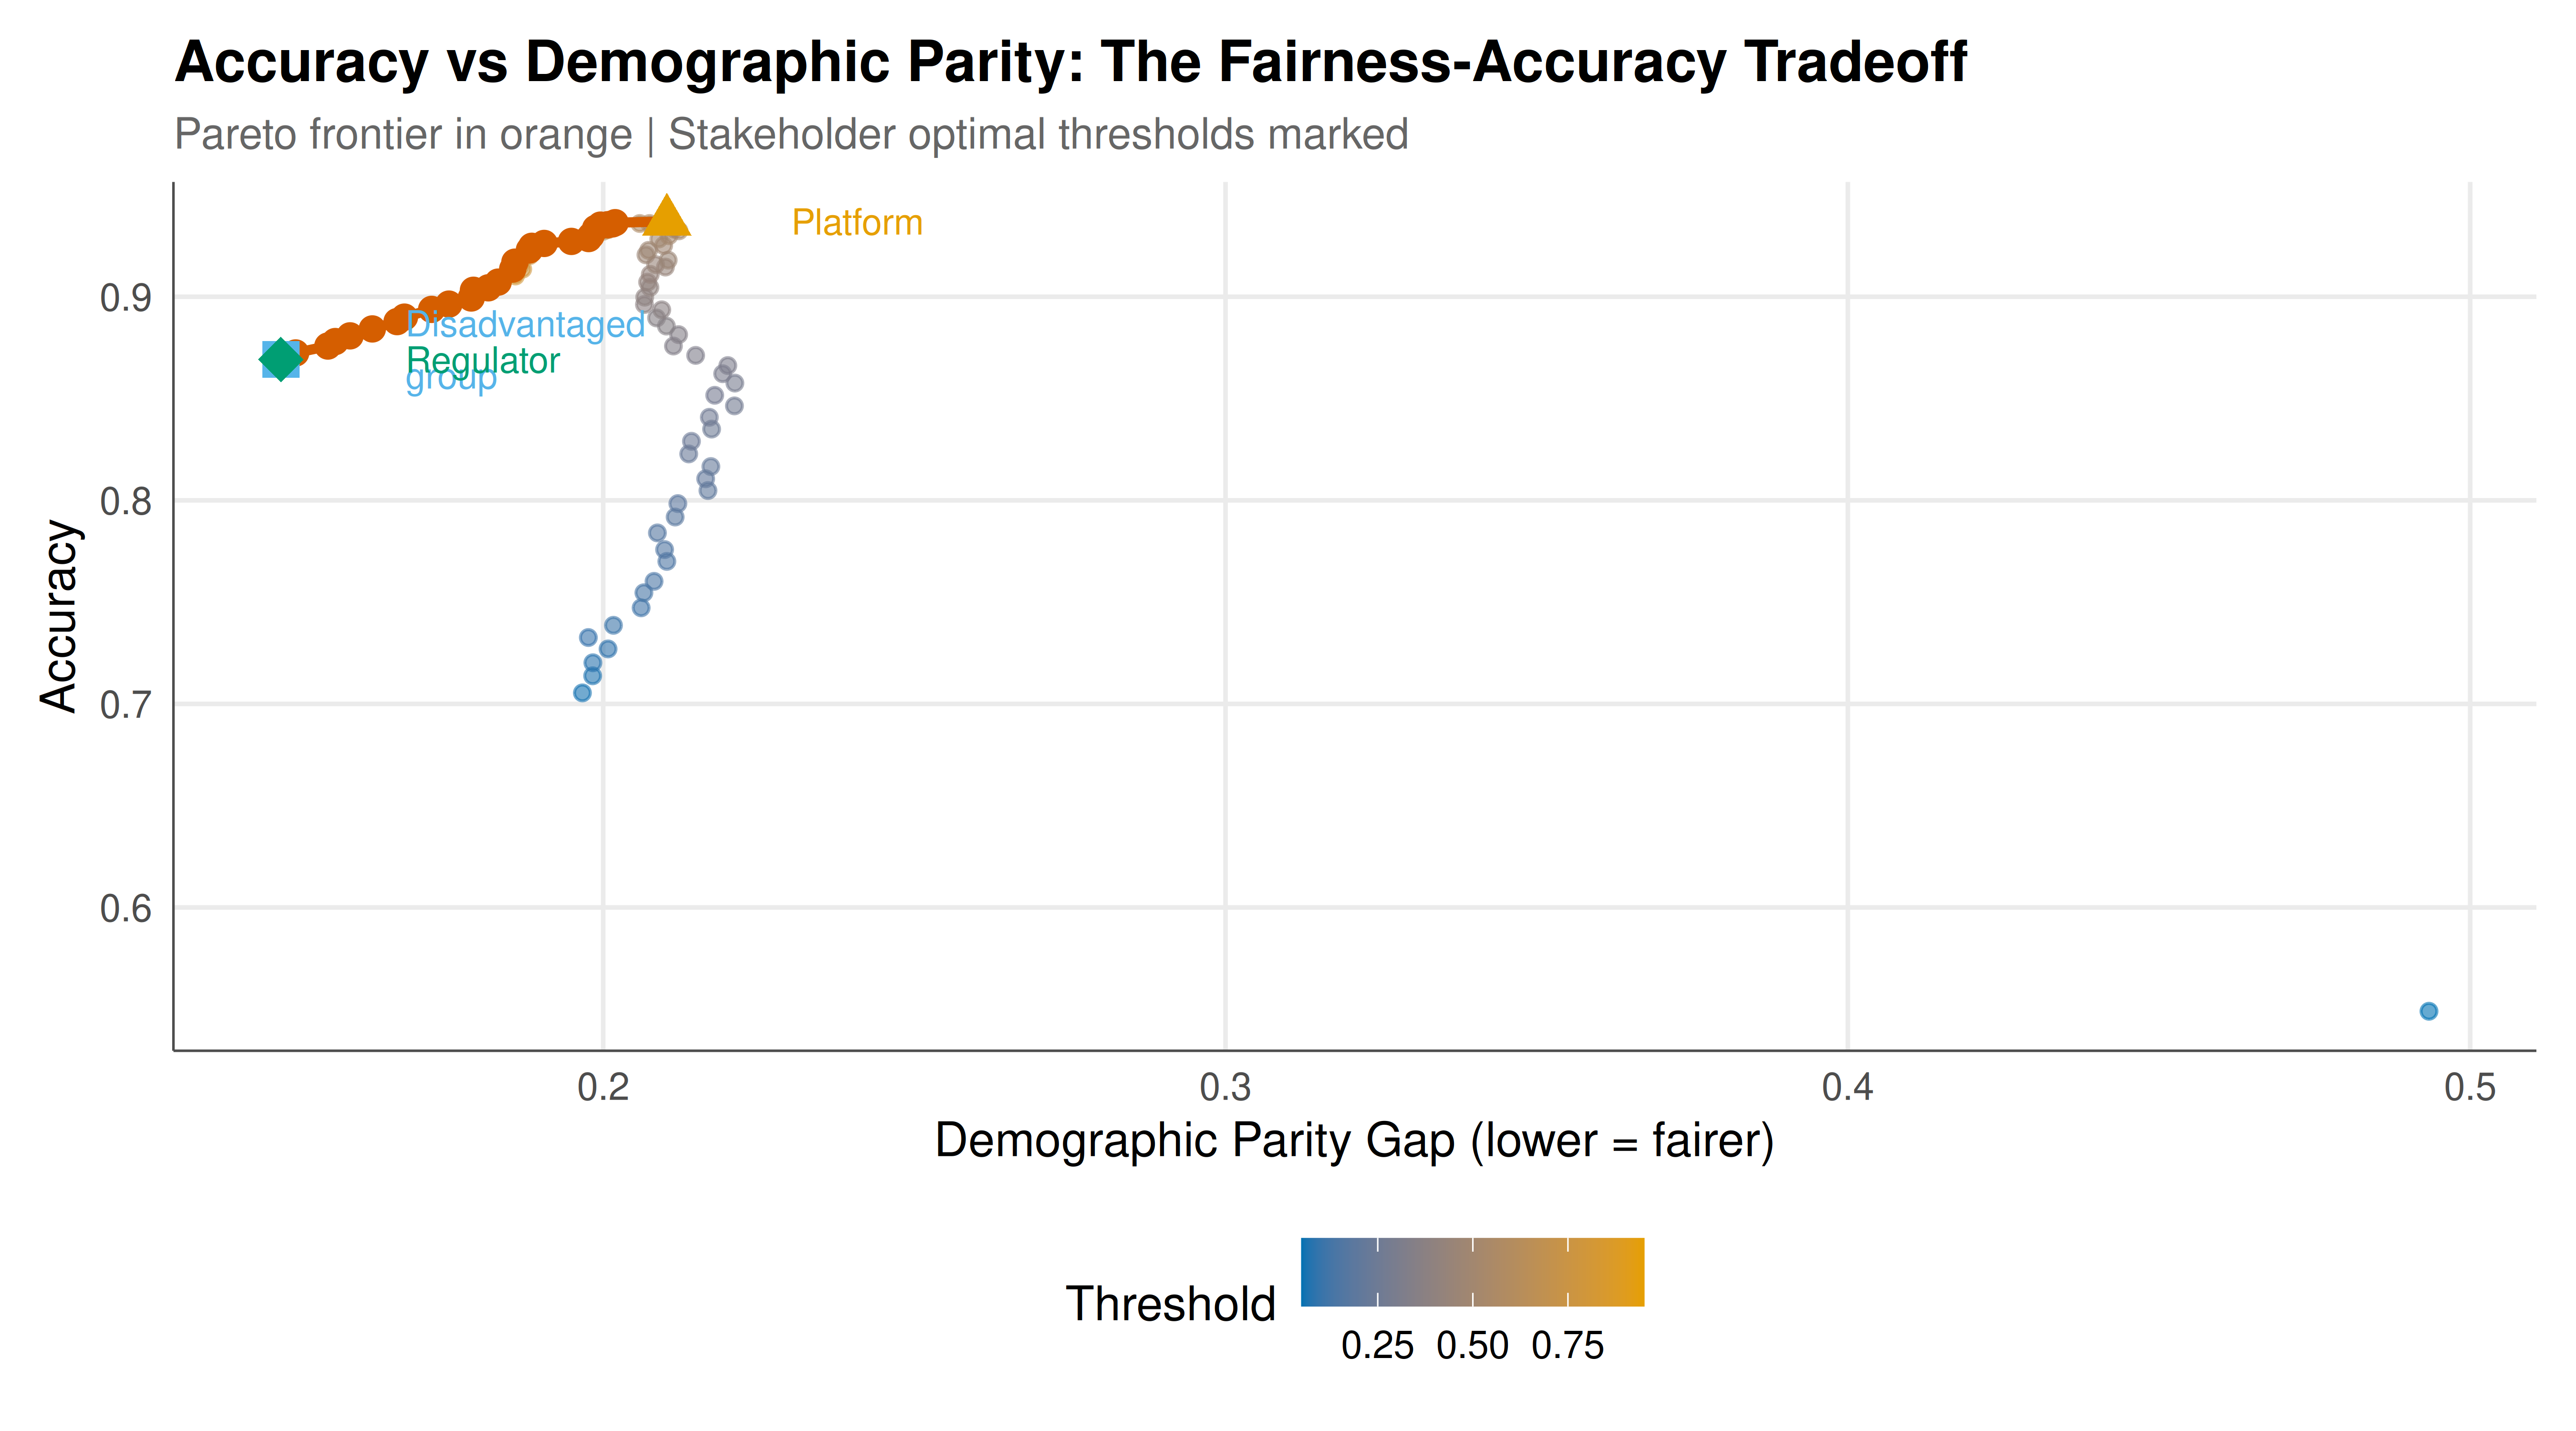
#| fig-cap: "Fairness-accuracy tradeoff landscape. Each point represents a classification threshold. The Pareto frontier (highlighted) shows the achievable tradeoffs between accuracy and demographic parity gap. No threshold simultaneously minimises all fairness gaps, illustrating the impossibility theorem."
#| dev: [png, pdf]
#| dpi: 300
#| fig-width: 9
#| fig-height: 5
# Reshape for facet-free plot
gap_long <- results |>
  select(threshold, accuracy, dp_gap, eo_gap, cal_gap) |>
  pivot_longer(cols = c(dp_gap, eo_gap, cal_gap),
               names_to = "criterion", values_to = "gap") |>
  mutate(criterion = case_when(
    criterion == "dp_gap" ~ "Demographic Parity",
    criterion == "eo_gap" ~ "Equalised Odds",
    criterion == "cal_gap" ~ "Calibration"
  ))

p_main <- ggplot(results, aes(x = dp_gap, y = accuracy)) +
  geom_point(aes(colour = threshold), size = 1.5, alpha = 0.6) +
  geom_line(data = pareto_front |> arrange(dp_gap),
            aes(x = dp_gap, y = accuracy),
            colour = okabe_ito[6], linewidth = 1.2) +
  geom_point(data = pareto_front,
             aes(x = dp_gap, y = accuracy),
             colour = okabe_ito[6], size = 2.5) +
  # Mark stakeholder optima
  geom_point(data = results[which.max(results$u_platform), ],
             aes(x = dp_gap, y = accuracy),
             shape = 17, size = 4, colour = okabe_ito[1]) +
  geom_point(data = results[which.max(results$u_disadvantaged), ],
             aes(x = dp_gap, y = accuracy),
             shape = 15, size = 4, colour = okabe_ito[2]) +
  geom_point(data = results[which.max(results$u_regulator), ],
             aes(x = dp_gap, y = accuracy),
             shape = 18, size = 5, colour = okabe_ito[3]) +
  annotate("text", x = results$dp_gap[which.max(results$u_platform)] + 0.02,
           y = results$accuracy[which.max(results$u_platform)],
           label = "Platform", colour = okabe_ito[1], size = 3.2, hjust = 0) +
  annotate("text", x = results$dp_gap[which.max(results$u_disadvantaged)] + 0.02,
           y = results$accuracy[which.max(results$u_disadvantaged)] + 0.005,
           label = "Disadvantaged\ngroup", colour = okabe_ito[2], size = 3.2, hjust = 0) +
  annotate("text", x = results$dp_gap[which.max(results$u_regulator)] + 0.02,
           y = results$accuracy[which.max(results$u_regulator)],
           label = "Regulator", colour = okabe_ito[3], size = 3.2, hjust = 0) +
  scale_colour_gradient(low = okabe_ito[5], high = okabe_ito[1]) +
  labs(title = "Accuracy vs Demographic Parity: The Fairness-Accuracy Tradeoff",
       subtitle = "Pareto frontier in orange | Stakeholder optimal thresholds marked",
       x = "Demographic Parity Gap (lower = fairer)",
       y = "Accuracy",
       colour = "Threshold") +
  theme_publication()

p_main
```
## Interactive figure
```{r}
#| label: fig-fairness-interactive
#| fig-cap: "Interactive exploration of fairness metrics across thresholds. Hover to see the exact values of all fairness criteria and accuracy at each threshold."
results$label <- paste0(
  "Threshold: ", results$threshold,
  "\nAccuracy: ", round(results$accuracy, 4),
  "\nDP gap: ", round(results$dp_gap, 4),
  "\nEO gap: ", round(results$eo_gap, 4),
  "\nCAL gap: ", round(results$cal_gap, 4)
)

p_int <- ggplot(results, aes(x = threshold)) +
  geom_line(aes(y = accuracy, colour = "Accuracy", text = label), linewidth = 0.8) +
  geom_line(aes(y = dp_gap, colour = "DP Gap", text = label), linewidth = 0.8) +
  geom_line(aes(y = eo_gap, colour = "EO Gap", text = label), linewidth = 0.8) +
  geom_line(aes(y = cal_gap, colour = "CAL Gap", text = label), linewidth = 0.8) +
  scale_colour_manual(values = c("Accuracy" = okabe_ito[1],
                                  "DP Gap" = okabe_ito[2],
                                  "EO Gap" = okabe_ito[3],
                                  "CAL Gap" = okabe_ito[7])) +
  labs(title = "Fairness Criteria & Accuracy Across Thresholds",
       x = "Classification Threshold", y = "Value",
       colour = "Metric") +
  theme_publication()

ggplotly(p_int, tooltip = "text") |>
  config(displaylogo = FALSE,
         modeBarButtonsToRemove = c("select2d", "lasso2d"))
```
## Interpretation
The computational results presented here provide a concrete and vivid demonstration of the fundamental tensions in algorithmic fairness. Three key findings emerge from our analysis, each with important implications for policy, practice, and game-theoretic reasoning.
First, the impossibility theorem is not an abstract mathematical curiosity — it has immediate practical consequences. Our simulation shows that the thresholds that minimise demographic parity gap, equalised odds gap, and calibration gap are all different. At the DP-optimal threshold, the equalised odds and calibration gaps remain substantial. This means that a regulator who mandates demographic parity (as some equal opportunity laws implicitly require) will inevitably create violations of equalised odds and calibration. Conversely, a platform that optimises for calibration (arguing that its predictions are "equally accurate" for both groups) will produce disparate positive prediction rates. There is no escape from this tradeoff when base rates differ, and in many real-world settings — credit scoring, recidivism prediction, medical diagnosis — base rates do differ across demographic groups.
Second, the game-theoretic framing reveals that the choice of fairness criterion is fundamentally a matter of stakeholder negotiation, not technical optimisation. Our three stakeholders — the platform, the disadvantaged group, and the regulator — prefer different classification thresholds precisely because they weight accuracy and fairness differently. The platform's optimal threshold maximises accuracy with no regard for fairness gaps, producing a prediction that faithfully reflects the base-rate differences but treats the two groups very differently. The disadvantaged group's optimal threshold equalises positive prediction rates, but may sacrifice accuracy, potentially leading to worse outcomes for everyone (including the disadvantaged group, if less accurate predictions lead to worse decisions overall). The regulator's choice represents a compromise, but the specific compromise depends on the weight placed on fairness versus accuracy — a parameter that encodes a value judgement, not a technical fact.
The Pareto frontier makes these tradeoffs transparent and quantifiable. Every point on the frontier represents a threshold configuration where accuracy cannot be improved without increasing the fairness gap, and vice versa. Points below the frontier are dominated — one can improve accuracy, fairness, or both by moving to the frontier. The shape of the frontier — its curvature and extent — reveals the "price of fairness": how much accuracy must be sacrificed to achieve a given level of demographic parity. In our simulation, the frontier shows that small improvements in fairness near the accuracy-maximising threshold are relatively cheap, but achieving near-perfect demographic parity requires substantial accuracy sacrifices. This convex structure is typical and has important implications: incremental fairness improvements are most cost-effective, while demanding absolute fairness can be very expensive.
Third, our analysis highlights the strategic dimension of fairness that is often overlooked in the machine learning literature. In a purely technical treatment, the "right" threshold is determined by an objective function specified by the algorithm designer. But in practice, different stakeholders will advocate for different thresholds, and the outcome depends on their relative bargaining power, institutional constraints, and strategic behaviour. A disadvantaged group might lobby for demographic parity not because they believe it is the uniquely correct criterion, but because it produces the best outcome for them in this particular setting. A platform might argue for calibration not out of principled commitment, but because calibration-fair classifiers tend to be more accurate and more profitable. Recognising these strategic motivations is essential for designing regulation that achieves its intended goals.
The framework presented here is deliberately simplified to highlight the core conceptual points. Real-world settings involve many groups (not just two), intersecting characteristics (race, gender, age), multiple decisions (not just binary classification), and dynamic feedback effects (decisions today affect outcomes tomorrow). Each of these complications enriches the game-theoretic structure and makes the tradeoffs more complex. But the fundamental insight remains: algorithmic fairness is not a problem that admits a purely technical solution. It is a multi-stakeholder game where the choice of criterion, the choice of threshold, and the choice of enforcement mechanism are all strategic decisions with distributional consequences.
## Extensions & related tutorials
- **Intersectional fairness**: Extend the framework to multiple overlapping demographic groups, where ensuring fairness for each intersection creates even more severe tradeoffs — a richer game with more players and constraints.
- **Dynamic fairness and feedback loops**: Model how today's algorithmic decisions affect tomorrow's data distribution, creating a repeated game where fairness interventions have long-term strategic consequences.
- **Mechanism design for fair algorithms**: Apply mechanism design principles to create institutional rules (audit requirements, fairness certificates, liability frameworks) that incentivise platforms to deploy fair algorithms [@hurwicz_1960].
- **Cooperative game theory and fairness bargaining**: Use bargaining solutions (Nash bargaining, Kalai-Smorodinsky) to identify "fair" compromises between stakeholders, drawing on cooperative game theory [@nash_1950].
- **Experimental economics of fairness perceptions**: Design experiments where human subjects evaluate algorithmic decisions under different fairness criteria, connecting computational fairness to behavioural game theory [@fehr_gaechter_2000].
## References
::: {#refs}
:::