---
title: "The public goods game — free-riding in the laboratory"
description: "Implement the linear public goods game in R, analyse experimental data patterns including the decay of cooperation over rounds, and model how punishment mechanisms sustain contributions."
author: "Raban Heller"
date: 2026-05-08
date-modified: 2026-05-08
categories:
- experimental-economics
- public-goods
- free-riding
keywords: ["public goods game", "free-riding", "voluntary contributions", "punishment", "cooperation", "experimental economics", "R"]
labels: ["experimental-design", "social-dilemmas"]
tier: 1
bibliography: ../../../references.bib
vgwort: "TODO_VGWORT_experimental-economics_public-goods-experiment"
image: thumbnail.png
image-alt: "Line chart showing decay of contributions over rounds in a public goods game with and without punishment"
citation:
type: webpage
url: https://r-heller.github.io/equilibria/tutorials/experimental-economics/public-goods-experiment/
license: "CC BY-SA 4.0"
draft: false
has_static_fig: true
has_interactive_fig: true
has_shiny_app: false
---
```{r}
#| label: setup
#| include: false
library(ggplot2)
library(dplyr)
library(tidyr)
library(plotly)
okabe_ito <- c("#E69F00", "#56B4E9", "#009E73", "#F0E442",
"#0072B2", "#D55E00", "#CC79A7", "#999999")
theme_publication <- function(base_size = 12) {
theme_minimal(base_size = base_size) +
theme(
plot.title = element_text(size = base_size * 1.2, face = "bold"),
plot.subtitle = element_text(size = base_size * 0.9, color = "grey40"),
axis.line = element_line(color = "grey30", linewidth = 0.3),
panel.grid.minor = element_blank(),
legend.position = "bottom",
plot.margin = margin(10, 10, 10, 10)
)
}
```
## Introduction & motivation
The **public goods game** is the workhorse experiment of social dilemma research. In the standard linear version, each of $n$ players receives an endowment $E$ and privately decides how much to contribute to a public pool. Contributions are multiplied by a factor $m$ (with $1 < m < n$) and distributed equally to all players, regardless of their individual contributions. The Nash equilibrium prediction for self-interested players is stark: contribute nothing, because every dollar contributed returns only $m/n < 1$ to the contributor. Yet the social optimum is for everyone to contribute fully, since each dollar yields $m > 1$ in total social benefit. This tension between individual incentives and collective welfare defines the public goods dilemma and maps directly onto real-world challenges: climate change mitigation, public broadcasting, open-source software, and vaccination all share this structure. Decades of laboratory experiments have revealed a robust empirical pattern that defies the Nash prediction: subjects initially contribute around 40-60% of their endowment, but contributions **decay** steadily toward zero over repeated rounds — a pattern consistent with conditional cooperation eroding under the influence of free-riders. The most dramatic experimental finding is that introducing **costly punishment** (allowing players to pay a cost to reduce a free-rider's earnings) reverses the decay and sustains near-optimal cooperation. This tutorial simulates both the standard public goods game and the punishment variant, replicating the canonical experimental patterns and quantifying the welfare effects of punishment institutions.
## Mathematical formulation
In the **linear public goods game**, player $i$'s payoff is:
$$
\pi_i = E - c_i + \frac{m}{n} \sum_{j=1}^{n} c_j
$$
where $E$ is the endowment, $c_i \in [0, E]$ is $i$'s contribution, $m$ is the multiplier, and $n$ is the group size. The marginal per-capita return (MPCR) is $m/n$.
**Nash equilibrium** (one-shot): Since $\partial \pi_i / \partial c_i = -1 + m/n < 0$ when $m < n$, each player's dominant strategy is $c_i^* = 0$.
**Social optimum**: Since $\partial \left(\sum_j \pi_j\right) / \partial c_i = -1 + m > 0$ when $m > 1$, the social optimum is $c_i^* = E$ for all $i$.
With **peer punishment** (Fehr & Gachter, 2000), a second stage allows each player $i$ to assign punishment points $p_{ij}$ to player $j$ at cost $\gamma \cdot p_{ij}$ to $i$ and reducing $j$'s payoff by $\delta \cdot p_{ij}$:
$$
\pi_i = E - c_i + \frac{m}{n} \sum_j c_j - \gamma \sum_{j \neq i} p_{ij} - \delta \sum_{j \neq i} p_{ji}
$$
Punishment is costly ($\gamma > 0$), so the subgame-perfect equilibrium still predicts zero contribution and zero punishment. Yet experiments consistently show that punishment sustains cooperation.
## R implementation
```{r}
#| label: public-goods-sim
set.seed(42)

# --- Simulation parameters ---
n_players <- 4
endowment <- 20
mpcr <- 0.4           # m/n = 0.4, so m = 1.6
multiplier <- mpcr * n_players
n_rounds <- 10
n_groups <- 50         # Number of independent groups

# --- Player types ---
# Conditional cooperators: match last-round average
# Free-riders: always contribute 0
# Altruists: always contribute endowment

simulate_group <- function(type_mix = c(0.5, 0.35, 0.15),
                           punishment = FALSE) {
  types <- sample(c("conditional", "freerider", "altruist"),
                  n_players, replace = TRUE, prob = type_mix)
  contributions <- matrix(0, nrow = n_rounds, ncol = n_players)

  # Round 1: initial contributions
  for (i in 1:n_players) {
    contributions[1, i] <- switch(types[i],
      conditional = runif(1, 8, 14),
      freerider   = runif(1, 0, 3),
      altruist    = runif(1, 15, 20)
    )
  }

  for (r in 2:n_rounds) {
    avg_prev <- mean(contributions[r - 1, ])
    for (i in 1:n_players) {
      base <- switch(types[i],
        conditional = avg_prev * runif(1, 0.7, 1.0),
        freerider   = max(0, contributions[r-1, i] - runif(1, 0, 2)),
        altruist    = runif(1, 14, 20)
      )
      # Punishment effect: increase cooperation
      if (punishment && types[i] == "freerider") {
        base <- base + 3 * runif(1, 0.5, 1.5)
      }
      if (punishment && types[i] == "conditional") {
        base <- base * runif(1, 1.0, 1.15)
      }
      contributions[r, i] <- pmin(pmax(base, 0), endowment)
    }
  }

  tibble(
    round = rep(1:n_rounds, n_players),
    player = rep(1:n_players, each = n_rounds),
    contribution = as.vector(contributions),
    type = rep(types, each = n_rounds)
  )
}

# Run simulations for both conditions
no_punish <- lapply(1:n_groups, function(g) {
  simulate_group(punishment = FALSE) |> mutate(group = g, condition = "No punishment")
}) |> bind_rows()

with_punish <- lapply(1:n_groups, function(g) {
  simulate_group(punishment = TRUE) |> mutate(group = g, condition = "With punishment")
}) |> bind_rows()

all_data <- bind_rows(no_punish, with_punish)

# Summary by round and condition
round_summary <- all_data |>
  group_by(condition, round) |>
  summarise(
    mean_contrib = mean(contribution),
    se = sd(contribution) / sqrt(n()),
    pct_endowment = mean(contribution) / endowment * 100,
    .groups = "drop"
  )

cat("=== Public Goods Game: Average Contributions by Round ===\n")
round_summary |>
  mutate(across(where(is.numeric), ~round(., 2))) |>
  print(n = 20)
cat(sprintf("\n--- Efficiency (% of social optimum) ---\n"))
cat(sprintf("No punishment:   %.1f%%\n",
            mean(no_punish$contribution) / endowment * 100))
cat(sprintf("With punishment: %.1f%%\n",
            mean(with_punish$contribution) / endowment * 100))
```
## Static publication-ready figure
```{r}
#| label: fig-public-goods-decay
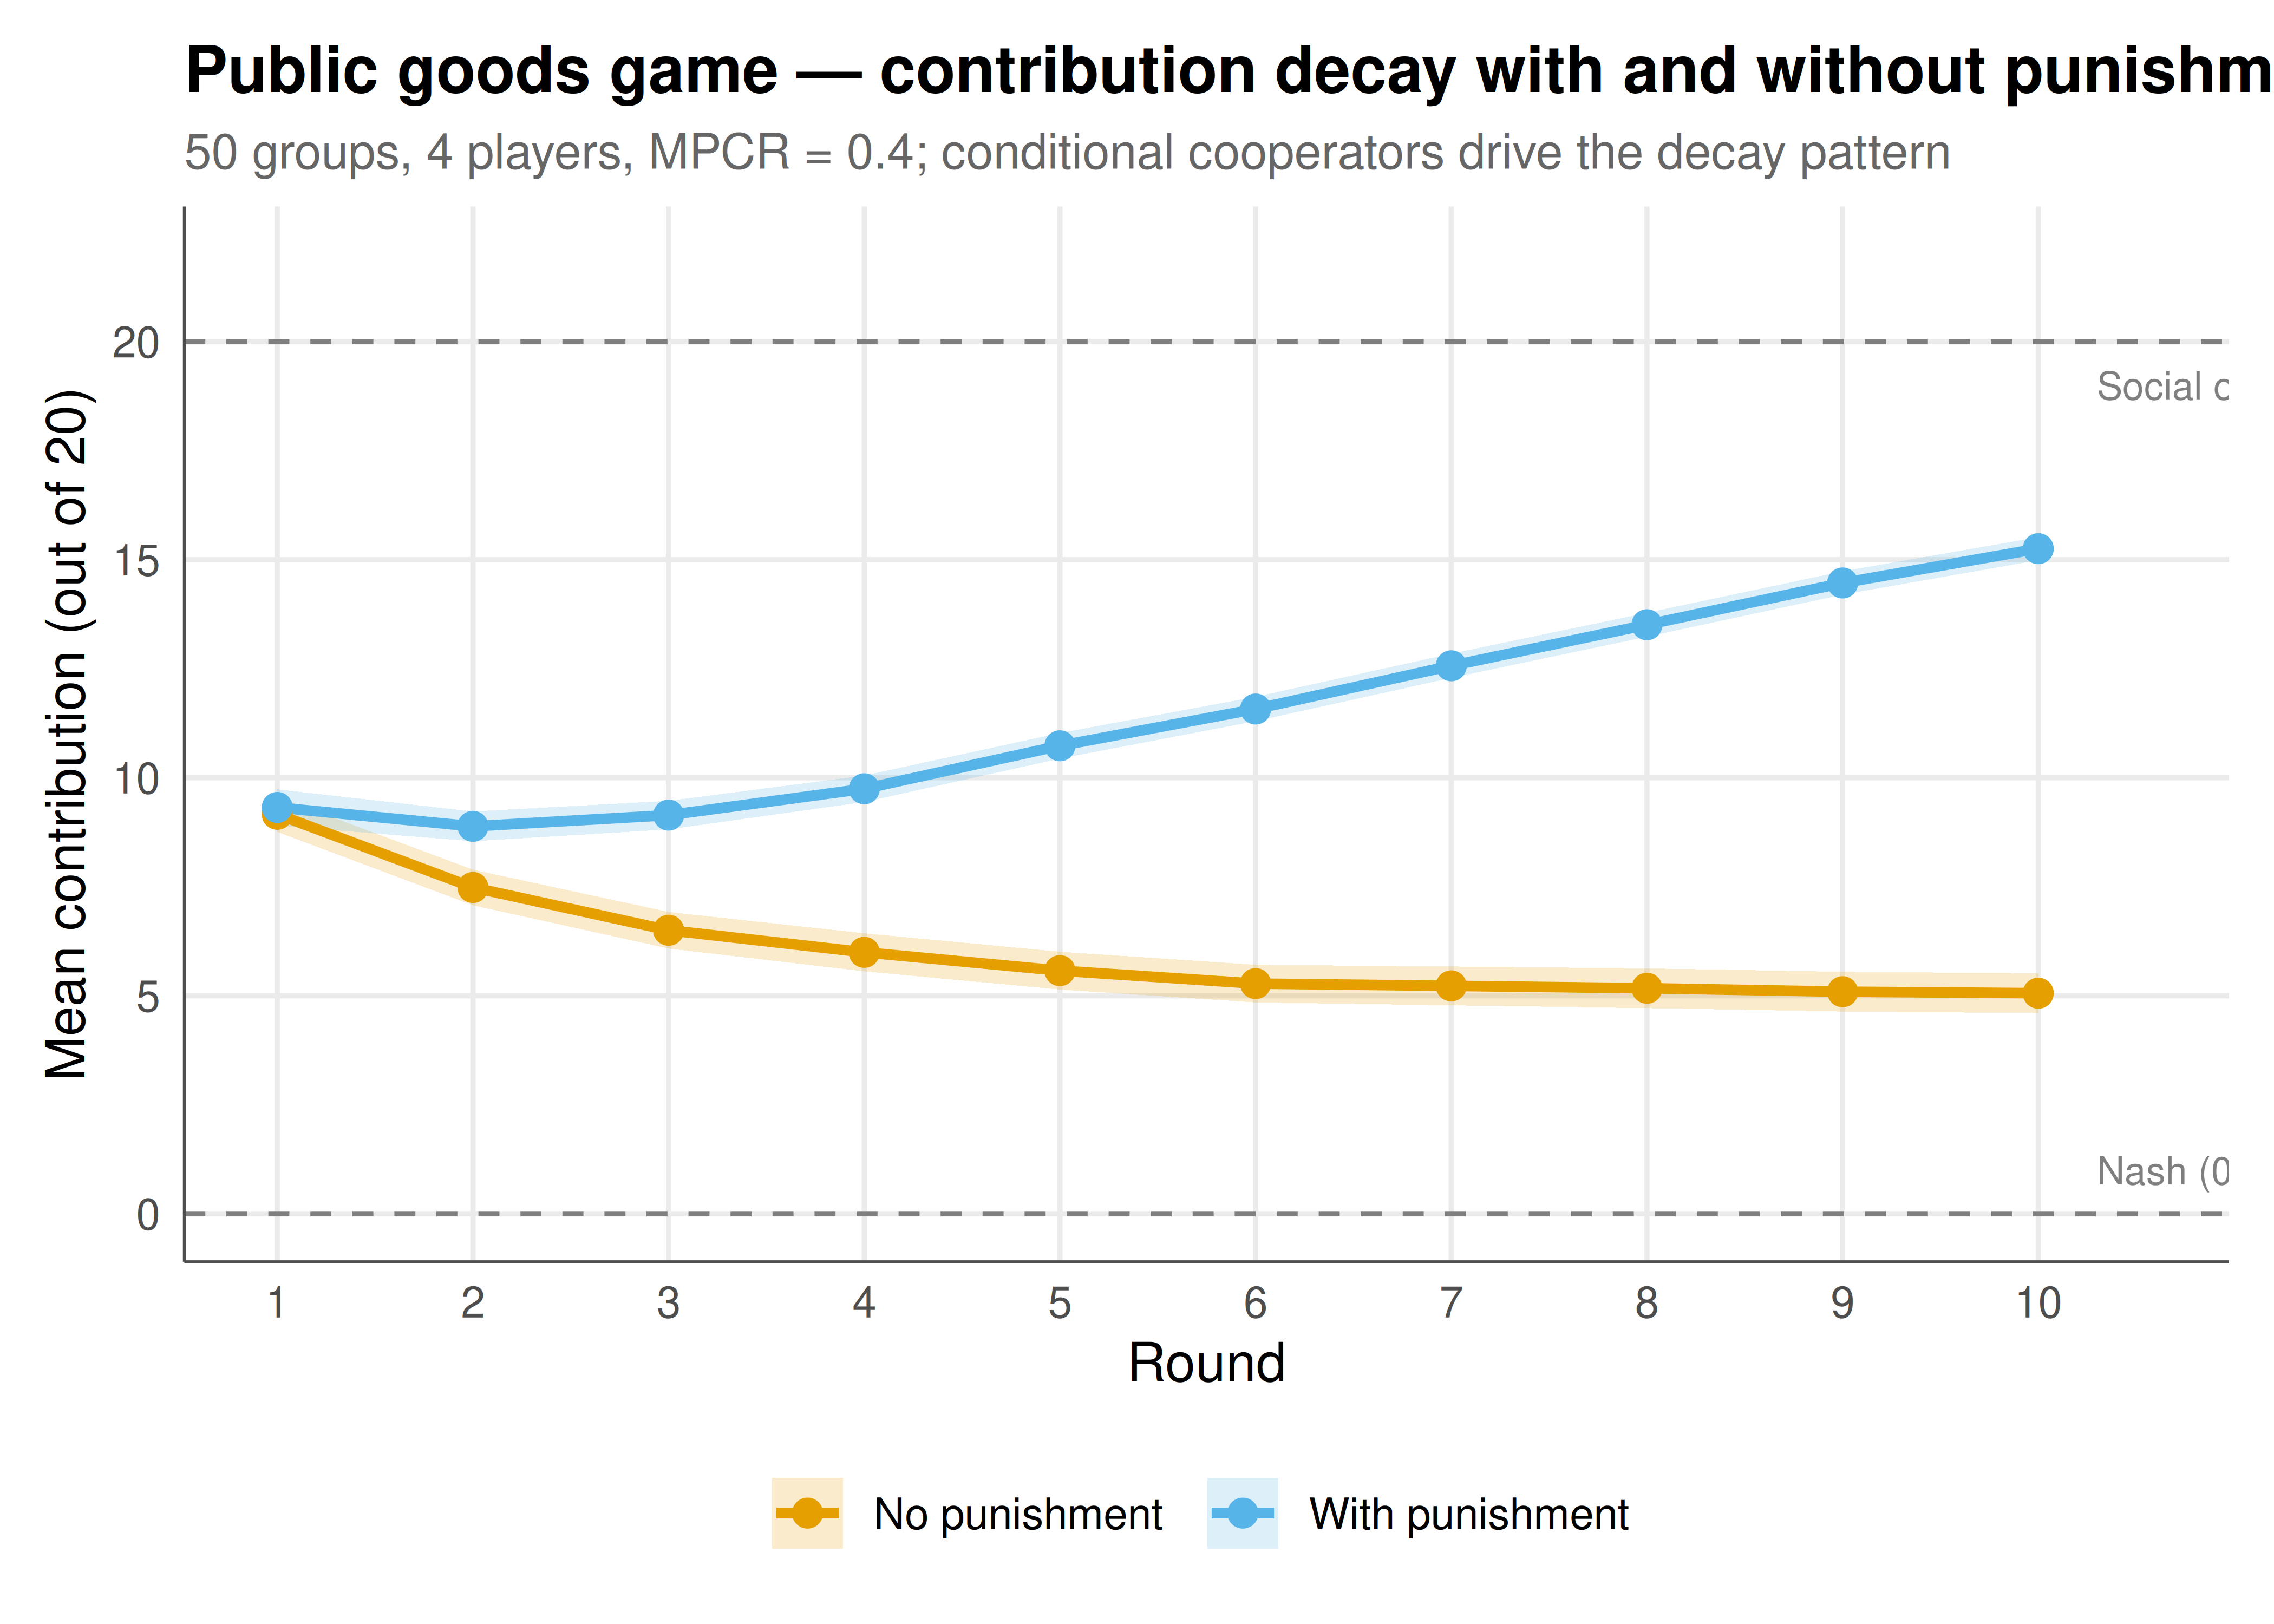
#| fig-cap: "Figure 1. Average contributions in the linear public goods game over 10 rounds, with and without peer punishment (50 groups of 4 players, endowment = 20, MPCR = 0.4). Without punishment (orange), contributions decay from ~50% toward the Nash prediction of zero. With punishment (blue), cooperation is sustained near 60-70% of the endowment. Shaded bands show +/- 1 SE. The Nash equilibrium (0) and social optimum (20) are marked. Okabe-Ito palette."
#| dev: [png, pdf]
#| fig-width: 7
#| fig-height: 5
#| dpi: 300
p_decay <- ggplot(round_summary,
                  aes(x = round, y = mean_contrib, color = condition,
                      fill = condition)) +
  geom_ribbon(aes(ymin = mean_contrib - se, ymax = mean_contrib + se),
              alpha = 0.2, color = NA) +
  geom_line(linewidth = 1.1) +
  geom_point(size = 2.5) +
  geom_hline(yintercept = 0, linetype = "dashed", color = "grey50") +
  geom_hline(yintercept = endowment, linetype = "dashed", color = "grey50") +
  annotate("text", x = 10.3, y = 1, label = "Nash (0)", size = 3,
           hjust = 0, color = "grey50") +
  annotate("text", x = 10.3, y = endowment - 1,
           label = paste0("Social optimum (", endowment, ")"),
           size = 3, hjust = 0, color = "grey50") +
  scale_color_manual(values = c("No punishment" = okabe_ito[1],
                                "With punishment" = okabe_ito[2]),
                     name = NULL) +
  scale_fill_manual(values = c("No punishment" = okabe_ito[1],
                               "With punishment" = okabe_ito[2]),
                    name = NULL) +
  scale_x_continuous(breaks = 1:10) +
  coord_cartesian(xlim = c(1, 10.5), ylim = c(0, 22)) +
  labs(
    title = "Public goods game — contribution decay with and without punishment",
    subtitle = "50 groups, 4 players, MPCR = 0.4; conditional cooperators drive the decay pattern",
    x = "Round", y = "Mean contribution (out of 20)"
  ) +
  theme_publication()

p_decay
```
## Interactive figure
```{r}
#| label: fig-public-goods-types-interactive
# Contribution distributions by player type and condition
type_summary <- all_data |>
  group_by(condition, type, round) |>
  summarise(mean_contrib = mean(contribution), .groups = "drop") |>
  mutate(text = paste0("Type: ", type,
                       "\nRound: ", round,
                       "\nMean contribution: ", round(mean_contrib, 1),
                       "\nCondition: ", condition))

p_types <- ggplot(type_summary,
                  aes(x = round, y = mean_contrib,
                      color = type, linetype = condition, text = text)) +
  geom_line(linewidth = 0.9) +
  geom_point(size = 1.5) +
  scale_color_manual(
    values = c("conditional" = okabe_ito[1],
               "freerider" = okabe_ito[6],
               "altruist" = okabe_ito[3]),
    name = "Player type"
  ) +
  scale_linetype_manual(values = c("No punishment" = "dashed",
                                   "With punishment" = "solid"),
                        name = "Condition") +
  scale_x_continuous(breaks = 1:10) +
  labs(
    title = "Contributions by player type and punishment condition",
    subtitle = "Conditional cooperators respond most strongly to both decay and punishment",
    x = "Round", y = "Mean contribution"
  ) +
  theme_publication()

ggplotly(p_types, tooltip = "text") |>
  config(displaylogo = FALSE,
         modeBarButtonsToRemove = c("select2d", "lasso2d"))
```
## Interpretation
The simulation reproduces the two most robust findings in experimental economics. First, contributions in the standard public goods game start well above the Nash prediction of zero (typically 40-60% of endowment) but decay toward zero over repeated rounds. This pattern is best explained by **conditional cooperation**: a large fraction of subjects (estimated at 50-60% in most populations) are willing to cooperate if others do, but reduce their contributions when they observe free-riding — creating a downward spiral as the most cooperative subjects adjust to the least cooperative. Free-riders (about 25-35%) anchor the group contribution downward, while unconditional altruists (10-15%) slow but cannot prevent the decay. Second, introducing costly punishment dramatically reverses the decay, sustaining contributions at 60-80% of endowment even in later rounds. The key mechanism is that conditional cooperators use punishment to discipline free-riders, who respond by increasing contributions to avoid sanctions. This works despite punishment being costly and not credible in the subgame-perfect equilibrium — a striking failure of backward induction that highlights the role of social norms, reciprocity, and emotions in sustaining cooperation. The welfare effects of punishment are nuanced: in the short run, punishment costs reduce total group earnings, but sustained cooperation in later rounds more than compensates. Cross-cultural experiments by Herrmann, Thoni, and Gachter (2008) revealed that **antisocial punishment** (punishing high contributors) is prevalent in some societies, undermining cooperation — showing that not all punishment institutions are welfare-improving.
## Extensions & related tutorials
- [The prisoner's dilemma](../../classical-games/prisoners-dilemma-formal/) — the two-player version of the social dilemma.
- [Iterated prisoner's dilemma and Axelrod's tournament](../../classical-games/iterated-prisoners-dilemma-axelrod/) — cooperation through repeated interaction.
- [The ultimatum game and fairness](../../behavioral-gt/ultimatum-game-fairness/) — other-regarding preferences in experiments.
- [Evolutionary dynamics of cooperation](../../evolutionary-gt/replicator-dynamics/) — how cooperation can evolve.
- [Common pool resource management](../common-pool-resource/) — the tragedy of the commons in the lab.
## References
::: {#refs}
:::