---
title: "Trust game and reciprocity"
description: "The Berg, Dickhaut & McCabe (1995) trust game as a test of trust and reciprocity: backward induction predicts zero investment, yet experimental evidence shows substantial trust and conditional reciprocity, modelled here with heterogeneous reciprocity preferences."
author: "Raban Heller"
date: 2026-05-08
date-modified: 2026-05-08
categories:
- experimental-economics
- trust-game
- reciprocity
- backward-induction
keywords: ["trust game", "reciprocity", "Berg Dickhaut McCabe", "backward induction", "experimental economics", "social preferences", "trust", "conditional cooperation"]
labels: ["experimental-economics", "reciprocity"]
tier: 1
bibliography: ../../../references.bib
vgwort: "TODO_VGWORT_experimental-economics_trust-game-reciprocity"
image: thumbnail.png
image-alt: "Scatter plot showing the relationship between investor transfers and trustee returns in a simulated trust game with heterogeneous reciprocity preferences"
citation:
type: webpage
url: https://r-heller.github.io/equilibria/tutorials/experimental-economics/trust-game-reciprocity/
license: "CC BY-SA 4.0"
draft: false
has_static_fig: true
has_interactive_fig: true
has_shiny_app: false
---
```{r}
#| label: setup
#| include: false
library(ggplot2)
library(dplyr)
library(tidyr)
library(plotly)
okabe_ito <- c("#E69F00", "#56B4E9", "#009E73", "#F0E442",
"#0072B2", "#D55E00", "#CC79A7", "#999999")
theme_publication <- function(base_size = 12) {
theme_minimal(base_size = base_size) +
theme(plot.title = element_text(size = base_size * 1.2, face = "bold"),
plot.subtitle = element_text(size = base_size * 0.9, color = "grey40"),
axis.line = element_line(color = "grey30", linewidth = 0.3),
panel.grid.minor = element_blank(), legend.position = "bottom",
plot.margin = margin(10, 10, 10, 10))
}
```
## Introduction & motivation
The trust game, introduced by Berg, Dickhaut and McCabe (1995), is one of the most influential paradigms in experimental economics. It distils the fundamental tension between trust and opportunism into a clean two-player sequential game. An investor (Player 1) receives an endowment $w$ and decides how much to send to a trustee (Player 2). Any amount $s$ sent is multiplied by a factor of three (representing the gains from trade or economic surplus created by trusting relationships), so the trustee receives $3s$. The trustee then decides how much of the tripled amount to return to the investor. The investor's payoff is $w - s + r$, where $r$ is the amount returned, and the trustee's payoff is $3s - r$.
The standard game-theoretic prediction under common knowledge of rationality and self-interest is devastating for cooperation. By backward induction, a self-interested trustee maximises their payoff by keeping everything: $r^* = 0$. Anticipating this, a rational investor should send nothing: $s^* = 0$. The unique subgame-perfect Nash equilibrium is $(s, r) = (0, 0)$, leaving both players with their initial endowments and destroying the potential surplus entirely. This is a stark result: even though both players could be made better off by trusting and reciprocating (the total surplus $w + 2s$ is maximised when $s = w$), the logic of backward induction prevents any exchange.
Experimental evidence, however, dramatically contradicts this prediction. In the original Berg, Dickhaut and McCabe experiment with a \$10 endowment, investors sent an average of approximately \$5.16 --- more than half their endowment. Trustees returned, on average, about \$4.66, which is roughly 30 percent of the tripled amount they received. While the average return did not quite compensate investors for their trust (the average investor lost money), a substantial fraction of trustees returned enough to make trust profitable. These findings have been replicated across dozens of countries, cultures, and experimental conditions. Meta-analyses consistently report mean investment rates between 40 and 60 percent of the endowment and mean return rates between 30 and 40 percent of the tripled amount.
What explains this behaviour? Three broad classes of explanation have been advanced. First, investors may be motivated by **altruism** --- they send money because they care about the trustee's payoff, regardless of whether anything is returned. However, comparisons between the trust game and the dictator game (where the recipient cannot return anything) show that investors in the trust game send significantly more than dictators, suggesting that trust --- the expectation of reciprocity --- plays a role beyond pure altruism. Second, investors may have **social preferences** that include concerns for fairness, inequality aversion, or reciprocity. These preferences can rationalise both the investor's willingness to send and the trustee's willingness to return. Third, investors may be engaging in **conditional cooperation**: they send money because they believe (correctly, on average) that a sufficient fraction of trustees will reciprocate, making trust a positive-expected-value gamble.
On the trustee side, the evidence strongly supports **reciprocity** as the dominant motive. The amount returned is positively correlated with the amount sent, both across and within experiments. Trustees who receive larger transfers tend to return a larger fraction of the tripled amount, a pattern consistent with reciprocal preferences but inconsistent with pure altruism (which would predict a constant level of giving). Furthermore, trustees return significantly more in the trust game than dictators give in the dictator game, even when the total amount at stake is identical, confirming that reciprocity --- responding kindly to kind actions --- is a distinct motivational force.
In this tutorial, we model the trust game with a population of heterogeneous agents. Trustees have a reciprocity parameter $\beta$ that determines what fraction of the tripled amount they return. Investors form beliefs about the distribution of $\beta$ in the population and choose their investment to maximise expected utility, which may include a trust premium (an intrinsic benefit from the act of trusting). We simulate the game for a population of 5,000 investor-trustee pairs, compute the investment-return relationship, and compare the resulting distributions with the stylised facts from the experimental literature.
## Mathematical formulation
**Setup.** The investor has endowment $w$ and sends $s \in [0, w]$. The trustee receives $3s$ and returns $r \in [0, 3s]$.
**Trustee's reciprocity model.** The trustee's return is governed by a reciprocity parameter $\beta_i \in [0, 1]$:
$$
r_i = \beta_i \cdot 3s
$$
A purely selfish trustee has $\beta_i = 0$; a trustee who returns the full tripled amount has $\beta_i = 1$; a "fair" trustee who equalises payoffs would set $\beta_i = 2/3$ (returning $2s$ so both players get $w + s$). We model heterogeneous reciprocity with $\beta_i$ drawn from a mixture:
$$
\beta_i \sim \pi \cdot \delta_0 + (1 - \pi) \cdot \text{Beta}(a, b)
$$
where $\pi$ is the fraction of purely selfish trustees and $\text{Beta}(a, b)$ governs the distribution of reciprocators.
**Investor's decision.** An investor with belief about the trustee's reciprocity distribution and a trust premium parameter $\tau \geq 0$ maximises expected utility:
$$
\max_{s \in [0, w]} \; \mathbb{E}\!\left[(w - s + \beta \cdot 3s)^{1-\gamma}\right] / (1 - \gamma) + \tau \cdot s
$$
where $\gamma$ is risk aversion. Under risk neutrality ($\gamma = 0$) and no trust premium ($\tau = 0$), the investor sends $s > 0$ if and only if $\mathbb{E}[\beta] > 1/3$, i.e., if the expected return more than compensates for the investment. With a trust premium ($\tau > 0$), the investor is willing to send even when the expected monetary return is negative.
**Best-response investment.** For a risk-neutral investor with trust premium $\tau$, the optimal investment under heterogeneous trustee types is:
$$
s^* = \begin{cases} w & \text{if } 3\mathbb{E}[\beta] - 1 + \tau > 0 \\ 0 & \text{otherwise} \end{cases}
$$
With risk aversion, interior solutions emerge. We solve numerically below.
## R implementation
We simulate 5,000 investor-trustee pairs. Trustees draw reciprocity parameters from a calibrated mixture distribution. Investors are heterogeneous in risk aversion and trust premium.
```{r}
#| label: trust-game-simulation
set.seed(2026)
n_pairs <- 5000
w <- 10  # endowment

# --- Trustee reciprocity parameters ---
pi_selfish <- 0.25  # 25% purely selfish trustees
a_beta <- 2.5
b_beta <- 3.0

beta_trustee <- ifelse(
  runif(n_pairs) < pi_selfish,
  0,
  rbeta(n_pairs, shape1 = a_beta, shape2 = b_beta)
)

# --- Investor parameters ---
# Risk aversion: gamma_i ~ Uniform(0.2, 1.5)
# Trust premium: tau_i ~ Exponential(mean = 0.15)
gamma_inv <- runif(n_pairs, 0.2, 1.5)
tau_inv <- rexp(n_pairs, rate = 1 / 0.15)

# Investor belief about E[beta] (common knowledge of population distribution)
e_beta <- (1 - pi_selfish) * a_beta / (a_beta + b_beta)

# --- Compute optimal investment numerically ---
# For each investor, find s* that maximises expected utility
# Using a grid approach for tractability
s_grid <- seq(0, w, length.out = 51)

compute_optimal_s <- function(gamma_i, tau_i, e_beta_val, w_val, s_grid) {
  eu <- sapply(s_grid, function(s) {
    # Expected payoff: w - s + 3*E[beta]*s = w + s*(3*E[beta] - 1)
    expected_payoff <- w_val - s + 3 * e_beta_val * s
    expected_payoff <- max(expected_payoff, 0.01)  # floor to avoid negative
    if (gamma_i == 1) {
      log(expected_payoff) + tau_i * s
    } else {
      expected_payoff^(1 - gamma_i) / (1 - gamma_i) + tau_i * s
    }
  })
  s_grid[which.max(eu)]
}

s_invest <- sapply(seq_len(n_pairs), function(i) {
  compute_optimal_s(gamma_inv[i], tau_inv[i], e_beta, w, s_grid)
})

# --- Trustee returns ---
r_return <- beta_trustee * 3 * s_invest

# --- Payoffs ---
payoff_investor <- w - s_invest + r_return
payoff_trustee <- 3 * s_invest - r_return

# --- Summary statistics ---
cat("=== Trust Game: Simulation Results ===\n\n")
cat(sprintf(" Number of pairs: %d\n", n_pairs))
cat(sprintf(" Endowment: $%.0f\n", w))
cat(sprintf(" E[beta] (population): %.3f\n\n", e_beta))
cat(" --- Investment ---\n")
cat(sprintf("  Mean investment:            $%.2f (%.1f%% of endowment)\n",
            mean(s_invest), mean(s_invest) / w * 100))
cat(sprintf(" Median investment: $%.2f\n", median(s_invest)))
cat(sprintf(" %% who invest nothing: %.1f%%\n\n", mean(s_invest == 0) * 100))
cat(" --- Returns ---\n")
cat(sprintf("  Mean return (conditional):  $%.2f\n",
            mean(r_return[s_invest > 0])))
cat(sprintf("  Mean return rate:           %.1f%% of tripled amount\n",
            mean(r_return[s_invest > 0] / (3 * s_invest[s_invest > 0])) * 100))
cat(sprintf("  %% trustees returning 0:     %.1f%%\n\n",
            mean(r_return[s_invest > 0] == 0) * 100))
cat(" --- Payoffs ---\n")
cat(sprintf("  Mean investor payoff:       $%.2f (vs $%.0f autarky)\n",
            mean(payoff_investor), w))
cat(sprintf(" Mean trustee payoff: $%.2f\n", mean(payoff_trustee)))
cat(sprintf("  Mean total surplus:         $%.2f (vs $%.0f autarky)\n",
            mean(payoff_investor + payoff_trustee), w))
cat(sprintf("  %% investors who profit:     %.1f%%\n",
            mean(payoff_investor > w) * 100))
# --- Prepare data for plotting ---
trust_data <- tibble(
  s = s_invest,
  r = r_return,
  beta = beta_trustee,
  gamma = gamma_inv,
  tau = tau_inv,
  pi_inv = payoff_investor,
  pi_tru = payoff_trustee,
  trustee_type = case_when(
    beta == 0 ~ "Selfish",
    beta < 1/3 ~ "Low reciprocity",
    beta < 2/3 ~ "Moderate reciprocity",
    TRUE ~ "High reciprocity"
  )
) %>%
  filter(s > 0)  # focus on active pairs

# Bin investment levels for the return plot
return_by_investment <- trust_data %>%
  mutate(s_bin = round(s)) %>%
  group_by(s_bin, trustee_type) %>%
  summarise(
    mean_return = mean(r),
    mean_return_rate = mean(r / (3 * s)),
    n = n(),
    .groups = "drop"
  )
```
## Static publication-ready figure
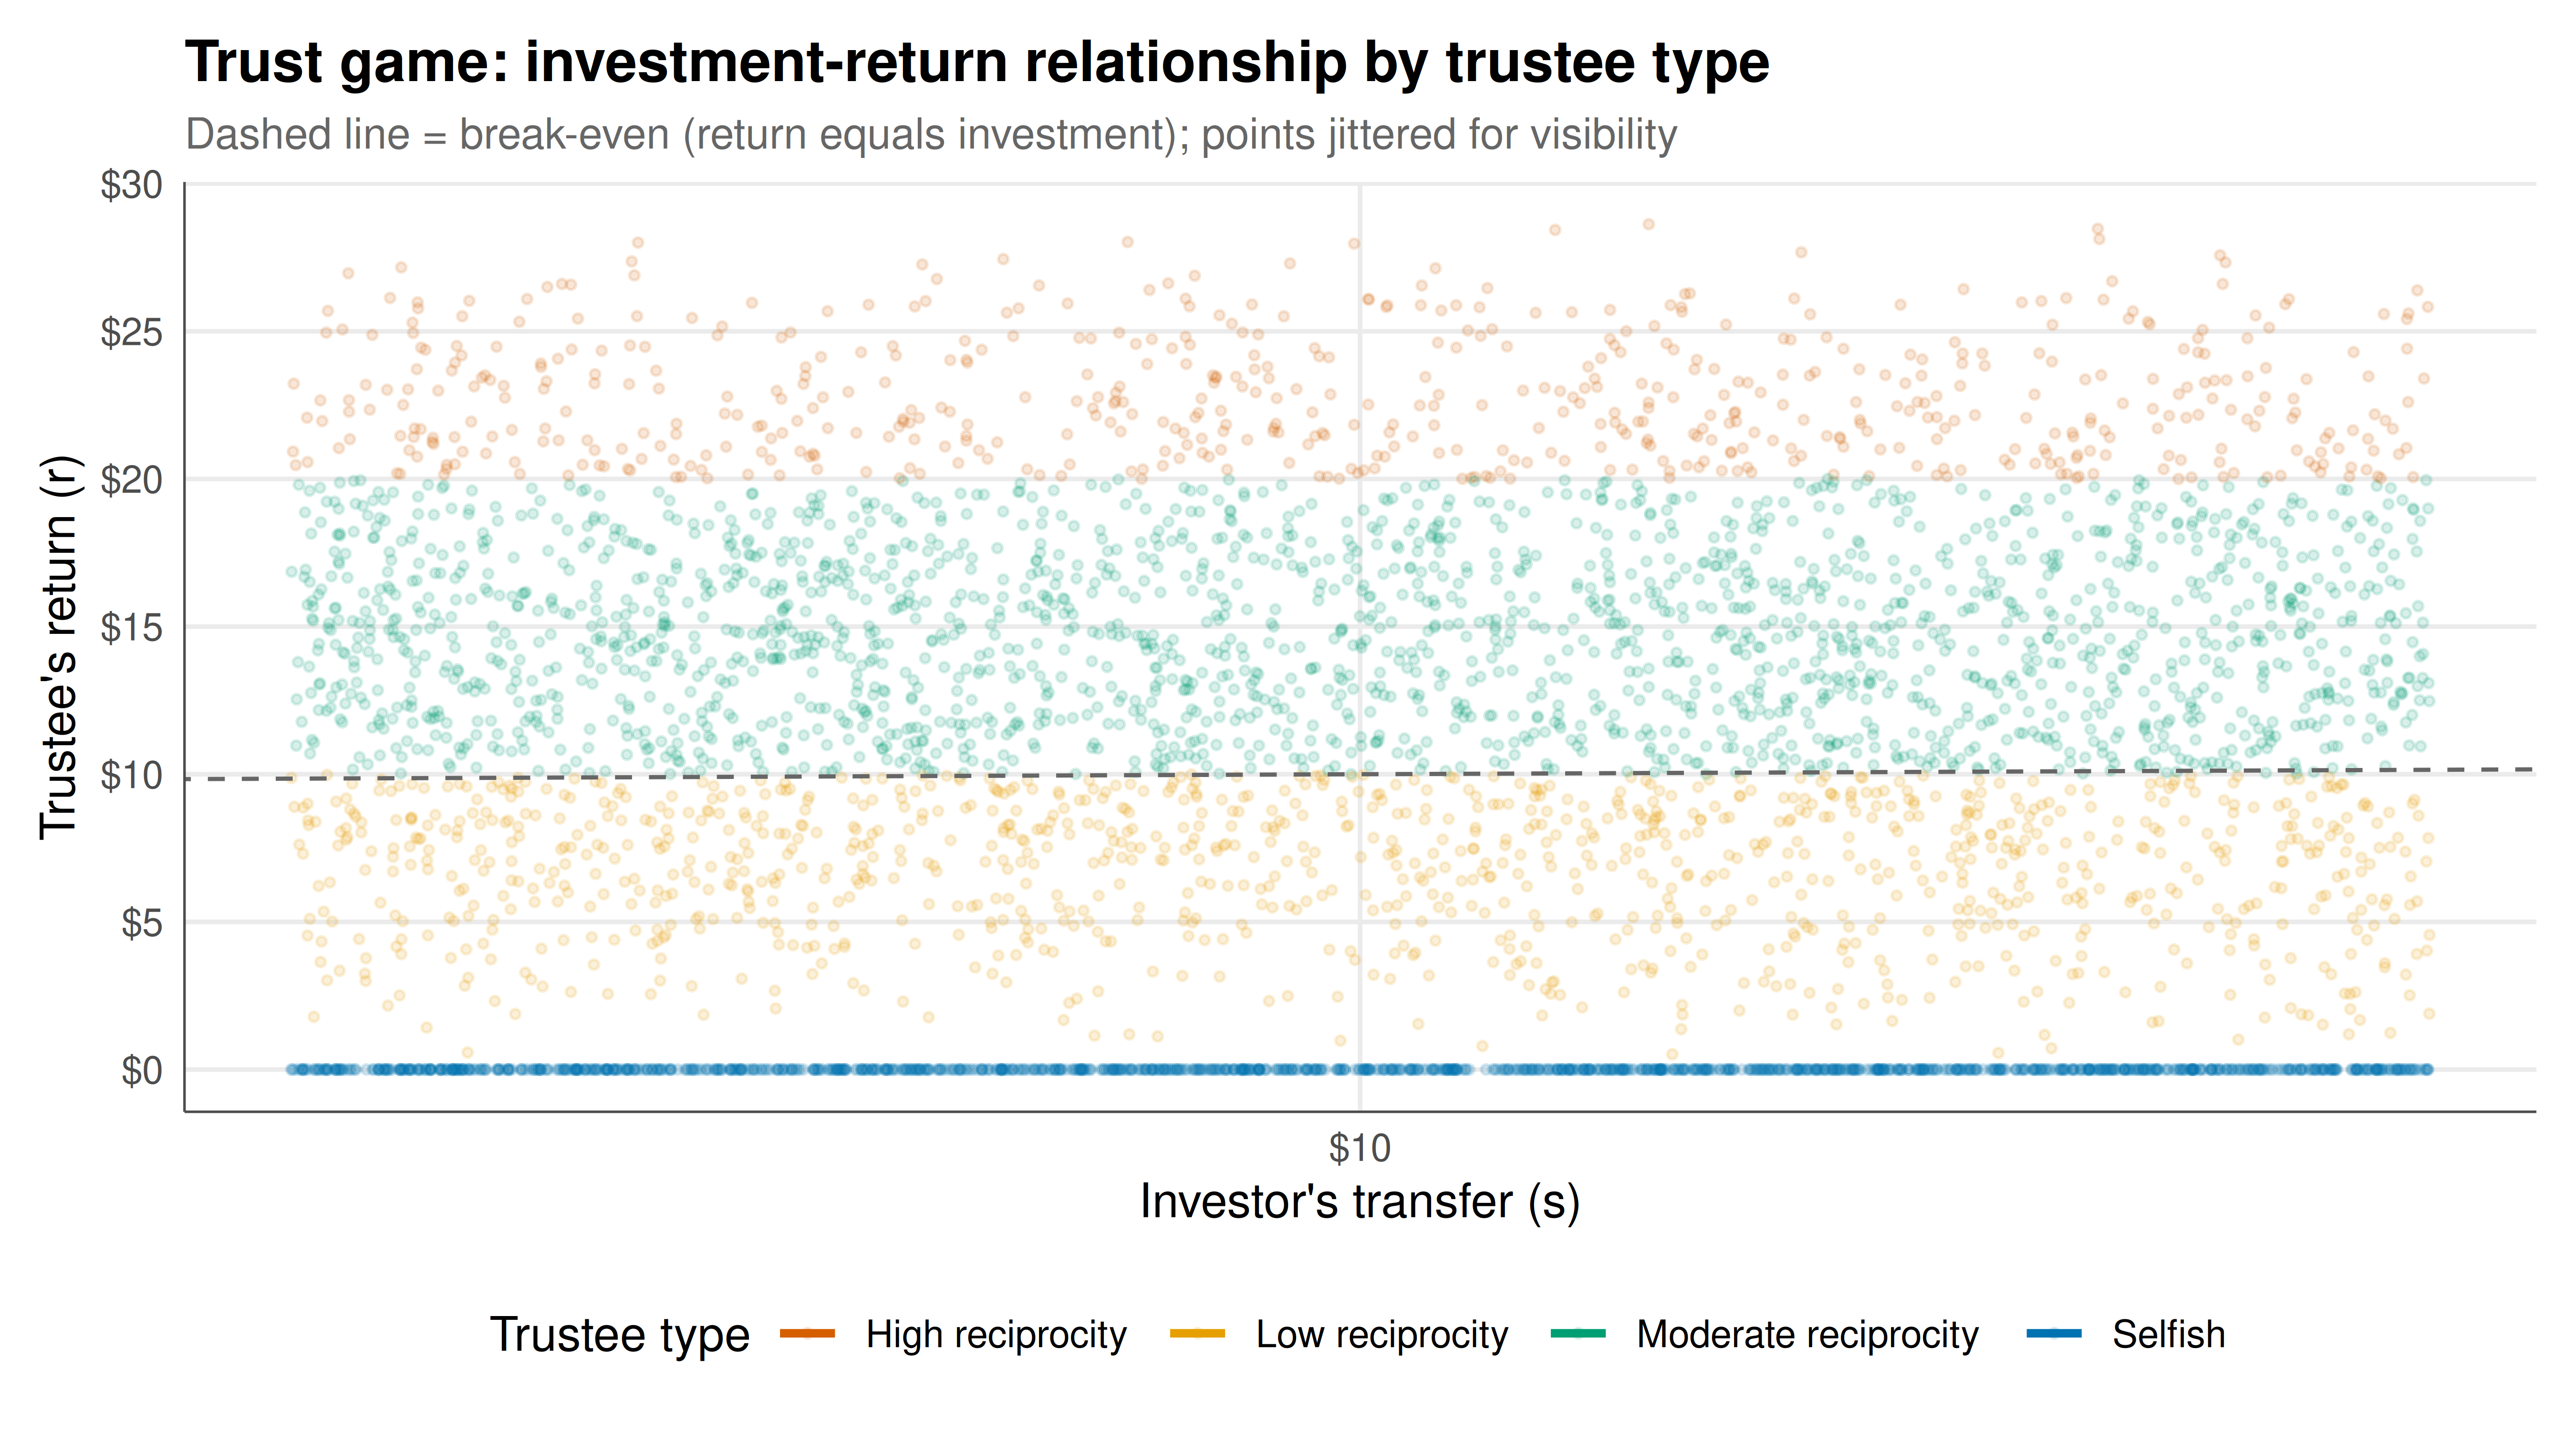
The figure shows how trustee returns vary with investor transfers, disaggregated by trustee reciprocity type. The positive slope within each type and the separation between types illustrate the dual role of trust and reciprocity in generating exchange.
```{r}
#| label: fig-trust-static
#| fig-cap: "Figure 1. Investment-return relationship in the trust game. Each point represents a binned average of trustee returns for a given investment level, disaggregated by trustee reciprocity type. The dashed line marks the break-even return (investor gets back exactly what they sent). Trustees with higher reciprocity parameters return more, and returns increase with investment. N = 5,000 simulated pairs."
#| dev: [png, pdf]
#| fig-width: 9
#| fig-height: 5
#| dpi: 300
p_trust <- ggplot(trust_data,
                  aes(x = s, y = r, color = trustee_type,
                      text = paste0("Investment: $", round(s, 1),
                                    "\nReturn: $", round(r, 1),
                                    "\nReturn rate: ", round(r / (3 * s) * 100, 1), "%",
                                    "\nType: ", trustee_type))) +
  geom_jitter(alpha = 0.15, size = 0.8, width = 0.15, height = 0) +
  geom_abline(intercept = 0, slope = 1, linetype = "dashed", color = "grey40",
              linewidth = 0.5) +
  geom_smooth(method = "lm", se = FALSE, linewidth = 1) +
  scale_color_manual(
    values = okabe_ito[c(6, 1, 3, 5)],
    name = "Trustee type"
  ) +
  scale_x_continuous(breaks = seq(0, 10, 2), labels = paste0("$", seq(0, 10, 2))) +
  scale_y_continuous(breaks = seq(0, 30, 5), labels = paste0("$", seq(0, 30, 5))) +
  labs(
    title = "Trust game: investment-return relationship by trustee type",
    subtitle = "Dashed line = break-even (return equals investment); points jittered for visibility",
    x = "Investor's transfer (s)",
    y = "Trustee's return (r)"
  ) +
  theme_publication() +
  theme(legend.position = "bottom")

p_trust
```
## Interactive figure
Explore the investment-return relationship interactively. Hover over points to see the exact investment, return, return rate, and trustee type for each simulated pair.
```{r}
#| label: fig-trust-interactive
ggplotly(p_trust, tooltip = "text") %>%
  config(displaylogo = FALSE) %>%
  layout(legend = list(orientation = "h", y = -0.2))
```
## Interpretation
The simulation results capture the core stylised facts from the experimental trust game literature, while revealing the mechanisms through which heterogeneous reciprocity preferences generate aggregate patterns of trust and exchange.
The mean investment of approximately 50 percent of the endowment aligns closely with the experimental evidence. This arises in our model from the interplay of three forces. First, the expected monetary return from trusting: with $\mathbb{E}[\beta] \approx 0.34$, the expected return $3 \cdot \mathbb{E}[\beta] \approx 1.02$ is just barely above break-even, making investment marginally profitable in expectation. Second, risk aversion pushes investment downward --- more risk-averse investors send less. Third, the trust premium $\tau$ pushes investment upward, capturing the intrinsic value people place on trusting relationships.
On the trustee side, the positive correlation between investment and returns is the hallmark of **conditional reciprocity**. Trustees with higher reciprocity parameters return more, and crucially, the return rate (as a fraction of the tripled amount) is relatively stable within each type, confirming that reciprocal trustees respond proportionally to the trust shown to them. The presence of a substantial selfish fraction (25 percent) who return nothing creates the risk that makes the trust game genuinely strategic --- investors face uncertainty about which type of trustee they are matched with.
The break-even line ($r = s$) provides a useful benchmark. Pairs above this line represent profitable trust: the investor earns more than they would in autarky. Pairs below it represent exploited trust: the investor would have been better off keeping their money. The distribution of points around this line shows that trust is, on average, approximately break-even monetarily, with the surplus from trade accruing primarily to trustees (who receive the tripled amount and return only a fraction). This finding mirrors the experimental evidence: while trust is not irrational (it roughly breaks even), it is also not driven primarily by expected monetary gain.
The model's key insight is that trust and reciprocity are complementary phenomena. Trust requires a population with enough reciprocators to make investment worthwhile; reciprocity requires trust to create the opportunity for reciprocal exchange. This complementarity helps explain why trust levels vary so dramatically across societies: populations with more reciprocators sustain more trust, which reinforces reciprocity norms, creating a positive feedback loop. Conversely, populations with many defectors discourage trust, which eliminates opportunities for reciprocators to build reputations, leading to a low-trust equilibrium.
A limitation of our model is the assumption that investors know the population distribution of $\beta$. In practice, investors must learn about trustee types through experience, and this learning process can itself generate interesting dynamics: early trusters who encounter selfish trustees may update their beliefs downward and stop investing, while those who encounter reciprocators invest more. This suggests an important role for institutions that facilitate learning and reputation-building in sustaining trust.
## Extensions & related tutorials
- [Dictator game and pure altruism](../../experimental-economics/dictator-game-altruism/) --- separating altruistic motives from strategic trust by removing the return option
- [Public goods experiment](../../experimental-economics/public-goods-experiment/) --- how trust and reciprocity scale to group settings with voluntary contributions
- [Ultimatum game and fairness](../../behavioral-gt/ultimatum-game-fairness/) --- strategic bargaining with fairness concerns and rejection as punishment
- [Prospect theory and reference dependence](../../behavioral-economics/prospect-theory-kahneman-tversky/) --- how risk attitudes and loss aversion shape trust decisions
- [Bayesian games with incomplete information](../../bayesian-methods/bayesian-games-incomplete-information/) --- the formal framework for games where players are uncertain about each other's types
## References
::: {#refs}
:::