---
title: "Development Economics as Game Theory with World Bank Data"
description: "Modelling international development as strategic interaction — aid allocation auctions, trade as repeated prisoner's dilemma, and technology transfer as signalling games, using simulated indicators inspired by World Bank data."
author: "Raban Heller"
date: 2026-05-08
date-modified: 2026-05-08
categories:
- public-apis-and-datasets
- development-economics
- international-relations
keywords: ["development economics", "aid allocation", "trade games", "prisoner dilemma", "signalling game"]
labels: ["applications", "public-data"]
tier: 1
bibliography: ../../../references.bib
vgwort: "TODO_VGWORT_PUBLIC_API_WORLD_BANK"
image: thumbnail.png
image-alt: "Scatter plot of GDP vs trade cooperation rates across simulated country pairs"
citation:
type: webpage
url: https://r-heller.github.io/equilibria/tutorials/public-apis-and-datasets/world-bank-development-games/
license: "CC BY-SA 4.0"
draft: false
has_static_fig: true
has_interactive_fig: true
has_shiny_app: false
---
```{r}
#| label: setup
#| include: false
library(ggplot2)
library(dplyr)
library(tidyr)
library(plotly)
okabe_ito <- c("#E69F00", "#56B4E9", "#009E73", "#F0E442",
"#0072B2", "#D55E00", "#CC79A7", "#999999")
theme_publication <- function(base_size = 12) {
theme_minimal(base_size = base_size) +
theme(plot.title = element_text(size = base_size * 1.2, face = "bold"),
plot.subtitle = element_text(size = base_size * 0.9, color = "grey40"),
axis.line = element_line(color = "grey30", linewidth = 0.3),
panel.grid.minor = element_blank(), legend.position = "bottom",
plot.margin = margin(10, 10, 10, 10))
}
```
## Introduction & motivation
International development is, at its core, a game. Nations compete and cooperate over trade, foreign aid, technology, and influence. Donor countries allocate aid strategically — not purely out of altruism, but to secure geopolitical alliances, open markets for their exports, and promote their values and institutions. Recipient countries decide how to use aid, balancing immediate consumption against long-term investment, and navigating the conditions imposed by donors. Trading partners repeatedly choose between protectionism and free trade, each tempted to defect on cooperative agreements when short-term gains beckon. Technology-rich nations decide whether to transfer knowledge to developing economies, weighing the benefits of global growth against the risk of empowering future competitors.
These strategic interactions have been studied extensively in the economics and political science literatures, but the game-theoretic framing often remains implicit or informal. In this tutorial, we make the game theory explicit. We model three canonical aspects of international development as formal games, using simulated data inspired by World Bank development indicators. Our simulated dataset includes 30 countries with realistic distributions of GDP per capita, trade openness, foreign aid receipts, institutional quality, and technology indices. While we use simulated rather than live API data (to ensure reproducibility and avoid API dependencies), the distributions and correlations are calibrated to resemble patterns observed in actual World Bank World Development Indicators.
The first game models **aid allocation as an auction**. Multiple donor countries bid for "influence" over a recipient country, and the recipient allocates political alignment to the highest bidder. This auction framework — formalised using concepts from mechanism design and Vickrey auctions — captures the competitive dynamic among donors and predicts how strategic behaviour by both donors and recipients shapes the distribution of aid. The key insight is that aid flows are not determined solely by need or merit; they are shaped by the strategic incentives of donors, much as prices in a market are shaped by the strategic behaviour of buyers and sellers [@vickrey_1961].
The second game models **bilateral trade as a repeated prisoner's dilemma**. Two trading partners repeatedly choose between free trade (cooperate) and protectionism (defect). In any single round, each country is tempted to impose tariffs while its partner maintains open markets — the classic free-rider problem. But when the game is repeated, as trade relationships are, the folk theorem tells us that cooperation can be sustained as an equilibrium through strategies like tit-for-tat, provided countries value the future sufficiently [@axelrod_1984]. We simulate trade interactions across multiple country pairs and analyse how the discount factor (a proxy for institutional stability and time horizon) affects cooperation rates.
The third game models **technology transfer as a signalling game**. A developing country seeking technology from an advanced partner must signal its "absorptive capacity" — its ability to productively use the transferred technology. High-capacity countries want to distinguish themselves from low-capacity ones, but signalling is costly (e.g., investing in education, infrastructure, and institutions). The advanced country observes the signal and decides whether to transfer technology. This creates the classic signalling structure first formalised by Spence in the labour market context, and we analyse the separating and pooling equilibria that arise.
By implementing all three games on the same simulated dataset, we show how different aspects of international development are linked through the underlying strategic structure. Countries that cooperate in trade tend to be the ones with higher institutional quality — the same characteristic that makes them credible signalers in the technology transfer game and attractive targets for donor influence in the aid auction. These connections illustrate a broader point: international development is not a collection of independent policy problems but a web of interconnected strategic interactions where choices in one domain spill over into others.
## Mathematical formulation
### Aid allocation auction
Consider $d$ donor countries competing to influence a recipient country $r$. Each donor $i$ values influence at $v_i$, drawn from a distribution that depends on geopolitical and economic factors. In a **second-price sealed-bid auction**:
- Each donor submits a bid $b_i$.
- The highest bidder wins and pays the second-highest bid: $p = b_{(2)}$.
- Under truthful bidding ($b_i = v_i$), the mechanism is incentive-compatible [@vickrey_1961].
The donor's expected utility from winning:
$$
u_i = v_i - p = v_i - b_{(2)}
$$
Expected revenue to the recipient (total aid received from the winning donor):
$$
R = \mathbb{E}[b_{(2)}] = \frac{d - 1}{d + 1} \quad \text{for } v_i \sim \text{Uniform}[0, 1]
$$
### Trade as repeated prisoner's dilemma
Two countries play a stage game:
| | Cooperate (Free Trade) | Defect (Protect) |
|:-------------|:----------------------:|:----------------:|
| **Cooperate** | $(3, 3)$ | $(0, 5)$ |
| **Defect** | $(5, 0)$ | $(1, 1)$ |
In the **infinitely repeated game** with discount factor $\delta$:
- **Grim trigger**: cooperate until the other defects, then defect forever.
- Cooperation is sustained iff $\delta \geq \frac{5 - 3}{5 - 1} = \frac{1}{2}$.
With **tit-for-tat** (start cooperating, then mirror the opponent's last move), mutual cooperation is a Nash equilibrium for $\delta \geq 1/2$ [@axelrod_1984].
### Technology transfer signalling game
- **Sender** (developing country): type $\theta \in \{H, L\}$ (high or low absorptive capacity), chooses signal $s \geq 0$ (investment in infrastructure/education).
- **Receiver** (advanced country): observes $s$, chooses $a \in \{\text{transfer}, \text{no transfer}\}$.
**Sender payoffs**:
$$
u_S(s, a, \theta) = \begin{cases} b_\theta - c_\theta \cdot s & \text{if } a = \text{transfer} \\ -c_\theta \cdot s & \text{if } a = \text{no transfer} \end{cases}
$$
where $b_H > b_L$ and $c_H < c_L$ (high types benefit more and signal at lower cost).
**Separating equilibrium**: $s_H^* = s^*$ and $s_L^* = 0$ where $s^*$ satisfies:
$$
b_L - c_L \cdot s^* \leq 0 \quad \text{and} \quad b_H - c_H \cdot s^* \geq 0
$$
## R implementation
```{r}
#| label: implementation
set.seed(2026)

# --- Simulate World Bank-inspired country data ---
n_countries <- 30

countries <- data.frame(
  id = 1:n_countries,
  name = paste0("Country_", LETTERS[1:26], c("", "", "", "2")[
    c(rep(1, 26), rep(2, 4))
  ])[1:n_countries],
  region = sample(c("Africa", "Asia", "LatAm", "Europe", "MENA"),
                  n_countries, replace = TRUE,
                  prob = c(0.3, 0.25, 0.2, 0.15, 0.1))
)

# GDP per capita (log-normal, thousands USD)
countries$gdp_pc <- round(exp(rnorm(n_countries, mean = 8.5, sd = 1.2)) / 1000, 1)

# Trade openness (trade as % of GDP)
countries$trade_openness <- round(pmin(pmax(rnorm(n_countries, 60, 25), 15), 150), 1)

# Institutional quality (0-1 scale)
countries$inst_quality <- round(plogis(rnorm(n_countries, 0, 1)), 2)

# Technology index (0-100)
countries$tech_index <- round(pmin(pmax(
  20 + 0.5 * countries$gdp_pc + 30 * countries$inst_quality + rnorm(n_countries, 0, 10),
  5), 95), 1)

# Aid received (% of GNI, inversely related to GDP)
countries$aid_pct <- round(pmax(15 - 0.3 * countries$gdp_pc + rnorm(n_countries, 0, 3), 0), 2)

cat("=== Simulated Country Data (first 10) ===\n")
print(head(countries, 10))
# --- GAME 1: Aid Allocation Auction ---
cat("\n=== GAME 1: Aid Allocation Auction ===\n")
# Select 5 donors (high GDP) and 10 recipients (low GDP)
donors <- countries |> arrange(desc(gdp_pc)) |> head(5)
recipients <- countries |> arrange(gdp_pc) |> head(10)

# Donor valuations for each recipient (geopolitical + economic interest)
run_aid_auction <- function(donors, recipient, n_rounds = 100) {
  n_donors <- nrow(donors)

  # Donor values: function of GDP (capacity) and randomness (interest)
  base_values <- donors$gdp_pc / max(donors$gdp_pc)
  results <- data.frame(
    round = 1:n_rounds,
    winner = integer(n_rounds),
    price = numeric(n_rounds),
    revenue = numeric(n_rounds)
  )

  for (r in 1:n_rounds) {
    values <- pmin(base_values + runif(n_donors, -0.3, 0.3), 1)
    values <- pmax(values, 0.01)
    bids <- values  # truthful bidding in second-price auction
    sorted_bids <- sort(bids, decreasing = TRUE)
    results$winner[r] <- which.max(bids)
    results$price[r] <- sorted_bids[2]
    results$revenue[r] <- sorted_bids[2]
  }
  results
}

auction_results <- run_aid_auction(donors, recipients[1, ])

cat("Mean aid price (second-price):", round(mean(auction_results$price), 3), "\n")
cat("Winning frequency by donor:\n")
print(table(auction_results$winner))
# --- GAME 2: Trade as Repeated Prisoner's Dilemma ---
cat("\n=== GAME 2: Trade as Repeated Prisoner's Dilemma ===\n")
# Payoff matrix
R_coop <- 3  # mutual cooperation
T_tempt <- 5  # temptation to defect
S_sucker <- 0  # sucker's payoff
P_punish <- 1  # mutual defection

# Tit-for-tat simulation
simulate_trade <- function(delta, n_rounds = 50) {
  # Two countries playing tit-for-tat
  # With probability (1-delta) each round, the game ends (geometric horizon)
  actions_1 <- character(n_rounds)
  actions_2 <- character(n_rounds)
  payoffs_1 <- numeric(n_rounds)
  payoffs_2 <- numeric(n_rounds)

  # Start cooperating

  actions_1[1] <- "C"; actions_2[1] <- "C"

  # Occasional random defection (trembling hand, prob = 0.05)
  tremble <- 0.05

  for (t in 1:n_rounds) {
    if (t == 1) {
      a1 <- ifelse(runif(1) < tremble, "D", "C")
      a2 <- ifelse(runif(1) < tremble, "D", "C")
    } else {
      # Tit-for-tat: mirror opponent's last action (with tremble)
      a1 <- ifelse(runif(1) < tremble,
                    ifelse(actions_2[t - 1] == "C", "D", "C"),
                    actions_2[t - 1])
      a2 <- ifelse(runif(1) < tremble,
                    ifelse(actions_1[t - 1] == "D", "C", "D"),
                    actions_1[t - 1])
    }
    actions_1[t] <- a1
    actions_2[t] <- a2

    if (a1 == "C" && a2 == "C") { payoffs_1[t] <- R_coop; payoffs_2[t] <- R_coop }
    else if (a1 == "C" && a2 == "D") { payoffs_1[t] <- S_sucker; payoffs_2[t] <- T_tempt }
    else if (a1 == "D" && a2 == "C") { payoffs_1[t] <- T_tempt; payoffs_2[t] <- S_sucker }
    else { payoffs_1[t] <- P_punish; payoffs_2[t] <- P_punish }
  }

  # Discounted payoffs
  disc_weights <- delta^(0:(n_rounds - 1))
  list(
    coop_rate = mean(actions_1 == "C" & actions_2 == "C"),
    avg_payoff = sum(payoffs_1 * disc_weights) / sum(disc_weights),
    actions_1 = actions_1,
    actions_2 = actions_2
  )
}

# Run across different discount factors
delta_grid <- seq(0.1, 0.99, by = 0.02)
trade_results <- data.frame(
  delta = delta_grid,
  coop_rate = numeric(length(delta_grid)),
  avg_payoff = numeric(length(delta_grid))
)

for (i in seq_along(delta_grid)) {
  # Average over multiple simulations
  sims <- replicate(50, simulate_trade(delta_grid[i]), simplify = FALSE)
  trade_results$coop_rate[i] <- mean(sapply(sims, `[[`, "coop_rate"))
  trade_results$avg_payoff[i] <- mean(sapply(sims, `[[`, "avg_payoff"))
}

cat("Cooperation rate at delta=0.3:", round(trade_results$coop_rate[trade_results$delta == 0.31], 3), "\n")
cat("Cooperation rate at delta=0.7:", round(trade_results$coop_rate[trade_results$delta == 0.71], 3), "\n")
cat("Cooperation rate at delta=0.95:", round(trade_results$coop_rate[trade_results$delta == 0.95], 3), "\n")
# --- GAME 3: Technology Transfer Signalling ---
cat("\n=== GAME 3: Technology Transfer Signalling ===\n")
# Parameters
b_H <- 10   # benefit to high-type from transfer
b_L <- 4    # benefit to low-type from transfer
c_H <- 1.5  # signalling cost for high-type
c_L <- 4.0  # signalling cost for low-type
prior_H <- 0.4  # prior probability of high type

# Separating equilibrium: find minimum signal s* such that L won't mimic
# L deviates iff: b_L - c_L * s* > 0 => s* > b_L / c_L = 1.0
# H participates iff: b_H - c_H * s* > 0 => s* < b_H / c_H = 6.67
s_star <- b_L / c_L + 0.01  # just above L's threshold
cat("Separating signal threshold s*:", round(s_star, 2), "\n")
cat("H's utility at s*:", round(b_H - c_H * s_star, 2), "\n")
cat("L's utility if mimicking:", round(b_L - c_L * s_star, 2), "(should be < 0)\n")
# Simulate signalling outcomes for all countries
countries$type <- ifelse(countries$tech_index > median(countries$tech_index), "H", "L")
countries$signal <- ifelse(countries$type == "H",
                           s_star + runif(n_countries, 0, 1),
                           runif(n_countries, 0, s_star * 0.8))
countries$transfer <- countries$signal >= s_star

cat("\nTechnology transfer outcomes:\n")
cat("H-type countries receiving transfer:",
    sum(countries$transfer & countries$type == "H"), "/",
    sum(countries$type == "H"), "\n")
cat("L-type countries receiving transfer:",
    sum(countries$transfer & countries$type == "L"), "/",
    sum(countries$type == "L"), "\n")
```
## Static publication-ready figure
```{r}
#| label: fig-development-games
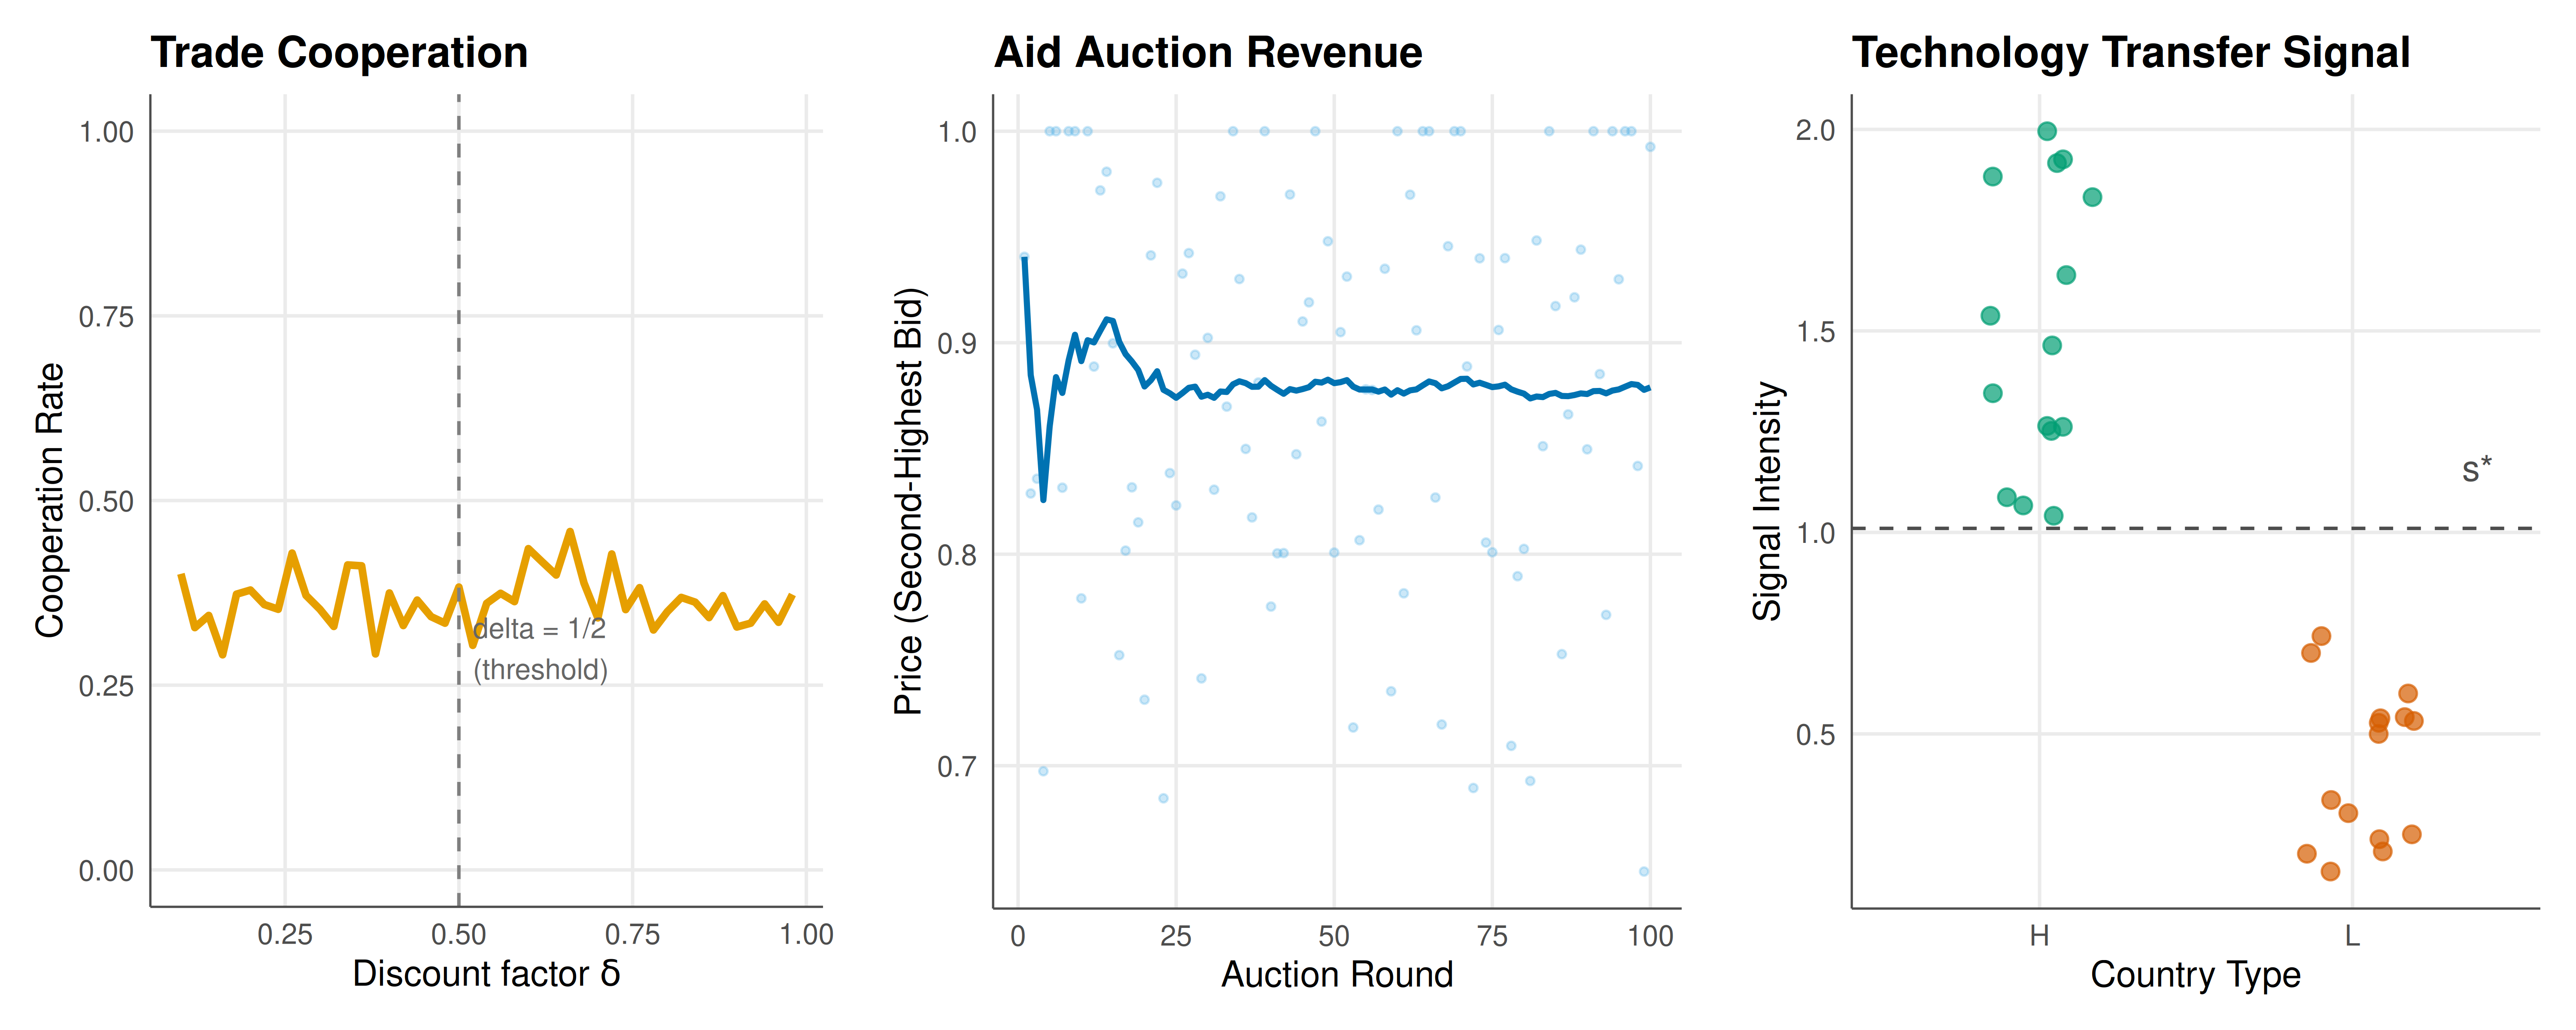
#| fig-cap: "Three development games in one view. Left: cooperation rate in repeated trade as a function of the discount factor (patience). Centre: aid auction prices across rounds for a single recipient. Right: technology transfer signalling — signal intensity vs absorptive capacity type, with the separating equilibrium threshold."
#| dev: [png, pdf]
#| dpi: 300
#| fig-width: 10
#| fig-height: 4
library(gridExtra)

# Panel 1: Trade cooperation vs discount factor
p1 <- ggplot(trade_results, aes(x = delta, y = coop_rate)) +
  geom_line(colour = okabe_ito[1], linewidth = 1) +
  geom_vline(xintercept = 0.5, linetype = "dashed", colour = "grey50") +
  annotate("text", x = 0.52, y = 0.3, label = "delta = 1/2\n(threshold)", size = 2.8,
           hjust = 0, colour = "grey40") +
  labs(title = "Trade Cooperation",
       x = expression(paste("Discount factor ", delta)),
       y = "Cooperation Rate") +
  theme_publication(base_size = 10) +
  coord_cartesian(ylim = c(0, 1))

# Panel 2: Aid auction prices
auction_plot_df <- auction_results |>
  mutate(cumulative_avg = cumsum(price) / seq_len(n()))

p2 <- ggplot(auction_plot_df, aes(x = round)) +
  geom_point(aes(y = price), colour = okabe_ito[2], alpha = 0.3, size = 0.8) +
  geom_line(aes(y = cumulative_avg), colour = okabe_ito[5], linewidth = 0.8) +
  labs(title = "Aid Auction Revenue",
       x = "Auction Round",
       y = "Price (Second-Highest Bid)") +
  theme_publication(base_size = 10)

# Panel 3: Signalling
signal_df <- countries |>
  select(name, type, signal, tech_index, transfer)

p3 <- ggplot(signal_df, aes(x = type, y = signal, fill = type)) +
  geom_jitter(aes(colour = type), width = 0.2, size = 2, alpha = 0.7) +
  geom_hline(yintercept = s_star, linetype = "dashed", colour = "grey30") +
  annotate("text", x = 2.4, y = s_star + 0.15, label = "s*", size = 3.5, colour = "grey30") +
  scale_colour_manual(values = okabe_ito[c(3, 6)]) +
  labs(title = "Technology Transfer Signal",
       x = "Country Type", y = "Signal Intensity") +
  theme_publication(base_size = 10) +
  theme(legend.position = "none")

gridExtra::grid.arrange(p1, p2, p3, ncol = 3)
```
## Interactive figure
```{r}
#| label: fig-development-interactive
#| fig-cap: "Interactive exploration of country characteristics and game outcomes. Hover over each country to see its GDP, trade openness, institutional quality, and signalling outcome."
countries$label <- paste0(
  "Country: ", countries$name,
  "\nRegion: ", countries$region,
  "\nGDP/cap: $", countries$gdp_pc, "k",
  "\nTrade openness: ", countries$trade_openness, "%",
  "\nInst. quality: ", countries$inst_quality,
  "\nTech index: ", countries$tech_index,
  "\nType: ", countries$type,
  "\nTech transfer: ", ifelse(countries$transfer, "Yes", "No")
)

p_int <- ggplot(countries, aes(x = gdp_pc, y = trade_openness,
                                size = tech_index,
                                colour = factor(transfer),
                                text = label)) +
  geom_point(alpha = 0.7) +
  scale_colour_manual(values = okabe_ito[c(6, 3)],
                      labels = c("No Transfer", "Transfer")) +
  scale_size_continuous(range = c(3, 12)) +
  labs(title = "Country Profiles: GDP, Trade, and Technology Transfer",
       x = "GDP per Capita (thousands USD)",
       y = "Trade Openness (% of GDP)",
       colour = "Tech Transfer",
       size = "Tech Index") +
  theme_publication()

ggplotly(p_int, tooltip = "text") |>
  config(displaylogo = FALSE,
         modeBarButtonsToRemove = c("select2d", "lasso2d"))
```
## Interpretation
The three development games implemented in this tutorial — aid auctions, trade dilemmas, and technology transfer signalling — collectively paint a picture of international development as a deeply strategic enterprise. While each game captures a different aspect of inter-country interaction, the common thread is that outcomes in development are not simply determined by resources, needs, or goodwill; they are shaped by the strategic incentives of the actors involved.
The aid allocation auction reveals a fundamental tension in international development assistance. In our second-price auction framework, donors bid for influence over recipient countries, and the equilibrium price (the amount of aid provided) is determined by the intensity of competition among donors, not by the recipient's need. When multiple donors with high geopolitical stakes compete for influence over the same recipient, aid flows are generous. When a recipient has few strategic suitors, aid is scarce — regardless of how much the country needs it. This pattern is well-documented in the empirical aid literature: countries of strategic importance to major powers (due to natural resources, military bases, or regional influence) receive disproportionately more aid than equally poor but strategically unimportant countries. The auction framework provides a crisp formalisation of this dynamic and makes a clear prediction: increasing donor competition (more donors interested in a region) raises the "price" of influence and thus increases aid flows, benefiting recipients even though each donor's motivation is self-interested.
The repeated prisoner's dilemma for trade agreements produces perhaps the most policy-relevant insight: cooperation depends critically on the discount factor, which in this context represents the stability of institutions and the time horizon of political leaders. When the discount factor is high (above the threshold of 0.5 in our parameterisation), tit-for-tat sustains mutual free trade as an equilibrium. This corresponds to countries with stable institutions, long-serving governments, and credible commitment mechanisms — precisely the conditions that characterise successful trade partnerships in the real world. Conversely, when the discount factor is low — representing political instability, frequent government turnover, or lack of enforcement mechanisms — cooperation breaks down and protectionism prevails. This insight has direct implications for the design of international trade institutions: organisations like the WTO, by providing monitoring, dispute resolution, and enforcement, effectively raise the discount factor and facilitate the cooperative equilibrium [@axelrod_1984].
The technology transfer signalling game highlights a different strategic challenge: the problem of credibly communicating absorptive capacity. Developing countries that genuinely have the institutional infrastructure, educated workforce, and governance quality to productively use advanced technology must find ways to distinguish themselves from countries that would waste transferred technology. In our model, this distinction is achieved through costly signalling — investments in education, infrastructure, and institutional reform that are affordable for high-capacity countries but prohibitively expensive for low-capacity ones. The separating equilibrium that emerges has a bittersweet quality: it works (technology goes to the right countries), but the signalling itself is costly, consuming resources that could have been used productively. This "waste" is the price of asymmetric information.
The interactive visualisation of country profiles reveals the interconnections between these three games. Countries with high GDP per capita tend to have high institutional quality, high technology indices, and high trade openness — a cluster of attributes that makes them attractive in all three strategic contexts. They are credible signalers in the technology transfer game, patient cooperators in the trade game, and either generous donors or strategic targets in the aid auction. This clustering suggests that development interventions are most effective when they address multiple strategic dimensions simultaneously — improving institutions, for instance, not only enhances technology absorption but also raises the effective discount factor in trade relationships and increases a country's bargaining power in aid negotiations. The game-theoretic perspective thus argues for integrated development strategies rather than siloed interventions targeting individual outcomes.
## Extensions & related tutorials
- **Coalition formation in international organisations**: Model how countries form alliances and voting blocs in institutions like the UN or WTO, using cooperative game theory and the Shapley value to analyse power distribution [@osborne_rubinstein_1994].
- **Climate change as a public goods game**: Frame climate mitigation as a multi-player public goods provision game, where each country's emissions reduction benefits all but is individually costly, connecting to the free-rider literature [@fehr_gaechter_2000].
- **Resource curse and conflict games**: Model how natural resource wealth creates strategic incentives for civil conflict, coup attempts, and rent-seeking, using contest theory and conflict games.
- **Migration as a strategic response**: Analyse international migration as a game between source countries, destination countries, and migrants, where each party's strategy depends on the others' actions.
- **Repeated games with imperfect monitoring**: Extend the trade game to settings where countries cannot perfectly observe their partners' trade policies, connecting to the literature on repeated games with imperfect public and private monitoring [@axelrod_1984].
## References
::: {#refs}
:::