---
title: "Spectrum auction design — from theory to billions in revenue"
description: "Analyse the FCC spectrum auctions as a mechanism design case study, model simultaneous ascending auctions and combinatorial bidding in R, and visualize revenue outcomes across major US spectrum sales."
author: "Raban Heller"
date: 2026-05-08
date-modified: 2026-05-08
categories:
- case-studies
- spectrum-auctions
- mechanism-design
keywords: ["spectrum auction", "FCC", "simultaneous ascending auction", "combinatorial bidding", "mechanism design", "telecom", "R"]
labels: ["auction-design", "policy-case-study"]
tier: 1
bibliography: ../../../references.bib
vgwort: "TODO_VGWORT_case-studies_spectrum-auction-design"
image: thumbnail.png
image-alt: "Bar chart of FCC spectrum auction revenues across major US sales from 1994 to 2024"
citation:
type: webpage
url: https://r-heller.github.io/equilibria/tutorials/case-studies/spectrum-auction-design/
license: "CC BY-SA 4.0"
draft: false
has_static_fig: true
has_interactive_fig: true
has_shiny_app: false
---
```{r}
#| label: setup
#| include: false
library(ggplot2)
library(dplyr)
library(tidyr)
library(plotly)
okabe_ito <- c("#E69F00", "#56B4E9", "#009E73", "#F0E442",
"#0072B2", "#D55E00", "#CC79A7", "#999999")
theme_publication <- function(base_size = 12) {
theme_minimal(base_size = base_size) +
theme(
plot.title = element_text(size = base_size * 1.2, face = "bold"),
plot.subtitle = element_text(size = base_size * 0.9, color = "grey40"),
axis.line = element_line(color = "grey30", linewidth = 0.3),
panel.grid.minor = element_blank(),
legend.position = "bottom",
plot.margin = margin(10, 10, 10, 10)
)
}
```
## Introduction & motivation
Before 1994, the US government allocated radio spectrum through a combination of administrative hearings and lotteries — processes that were slow, opaque, and generated no revenue. The Federal Communications Commission's (FCC) decision to auction spectrum rights, guided by game theorists including Paul Milgrom, Robert Wilson, and Preston McAfee, transformed telecommunications policy and became the most celebrated application of mechanism design to real-world markets. The challenge was formidable: spectrum licences are **complementary** (a carrier in New York needs adjacent frequencies in New Jersey) and **substitutable** (a carrier may want either Band A or Band B, but not both), creating a combinatorial allocation problem where simple sequential or simultaneous independent auctions would lead to the **exposure problem** — bidders winning some complementary licences but not others. The FCC's solution was the **Simultaneous Multiple Round Auction (SMRA)**, where all licences are sold simultaneously with ascending bids, allowing bidders to shift demand across markets as prices evolve. Later auctions introduced combinatorial (package) bidding and incentive auctions (two-sided markets). Since 1994, FCC auctions have raised over $230 billion, and the design has been adopted worldwide for 3G, 4G, and 5G spectrum. This tutorial models the SMRA mechanism and analyses revenue patterns across major FCC auctions, illustrating how theoretical game theory concepts — dominance, complementarity, and incentive compatibility — shaped one of the most consequential policy designs in modern economics.
## Mathematical formulation
In the **Simultaneous Multiple Round Auction**, $K$ licences are sold to $N$ bidders simultaneously. In each round $t$:
1. Each bidder $i$ submits bids $b_i^t(k)$ on licences $k \in \{1, \ldots, K\}$
2. The provisional winner for licence $k$ is $\arg\max_i b_i^t(k)$
3. Bids must satisfy the **activity rule**: a bidder's number of active bids must weakly decrease over time (no "sniping")
The auction ends when no new bids are submitted in a round. The **exposure problem** arises when a bidder values a bundle $\{A, B\}$ at $v(AB) > v(A) + v(B)$ but may win only one item:
$$
\text{Exposure risk} = v(A) - b(A) < 0 \quad \text{if bidder wins } A \text{ but not } B
$$
**Combinatorial (package) bidding** addresses this by allowing bids on bundles. In the Vickrey-Clarke-Groves (VCG) mechanism for combinatorial auctions, the payment for winning bidder $i$ is:
$$
p_i = \max_{a_{-i}} \sum_{j \neq i} v_j(a_{-i}(j)) - \sum_{j \neq i} v_j(a^*(j))
$$
where $a^*$ is the efficient allocation and $a_{-i}$ is the efficient allocation excluding bidder $i$. This is the externality that $i$ imposes on others, ensuring truthful bidding is a dominant strategy.
## R implementation
```{r}
#| label: spectrum-auction-sim
# --- Simulate a simplified SMRA auction ---
set.seed(123)
n_bidders <- 5
n_licences <- 4
n_rounds_max <- 50

# True valuations: each bidder has private values + synergy for adjacent pairs
values <- matrix(runif(n_bidders * n_licences, 50, 200),
                 nrow = n_bidders, ncol = n_licences)
# Synergy: 20% bonus for holding adjacent licences
synergy <- 0.20

# Simple SMRA simulation (myopic best-response bidding)
current_price <- rep(0, n_licences)
current_winner <- rep(NA, n_licences)
increment <- 5
history <- tibble(round = integer(), licence = integer(),
                  price = numeric(), bidder = integer())

for (round in 1:n_rounds_max) {
  new_bid <- FALSE
  bid_order <- sample(1:n_bidders)
  for (i in bid_order) {
    for (k in 1:n_licences) {
      if (is.na(current_winner[k]) || current_winner[k] != i) {
        # Check if bidding is profitable
        standalone_value <- values[i, k]
        # Add synergy if bidder holds adjacent licence
        if (k > 1 && !is.na(current_winner[k-1]) && current_winner[k-1] == i)
          standalone_value <- standalone_value * (1 + synergy)
        if (k < n_licences && !is.na(current_winner[k+1]) && current_winner[k+1] == i)
          standalone_value <- standalone_value * (1 + synergy)

        bid <- current_price[k] + increment
        if (bid < standalone_value) {
          current_price[k] <- bid
          current_winner[k] <- i
          new_bid <- TRUE
          history <- bind_rows(history,
            tibble(round = round, licence = k, price = bid, bidder = i))
        }
      }
    }
  }
  if (!new_bid) break
}

cat("=== SMRA Auction Results ===\n")
cat(sprintf("Auction ended after %d rounds\n", max(history$round)))
final <- tibble(licence = 1:n_licences,
                winner = current_winner,
                price = current_price)
print(final)
cat(sprintf("Total revenue: $%.0f\n", sum(current_price)))
# --- Historical FCC auction data (selected major auctions) ---
fcc_data <- tibble(
  auction = c("PCS A/B (1995)", "PCS C (1996)", "AWS-1 (2006)",
              "700 MHz (2008)", "AWS-3 (2015)", "Incentive (2017)",
              "C-Band (2021)", "3.45 GHz (2022)"),
  year = c(1995, 1996, 2006, 2008, 2015, 2017, 2021, 2022),
  revenue_bn = c(7.7, 10.2, 13.7, 19.6, 44.9, 19.8, 81.2, 22.5),
  n_licences = c(99, 493, 1122, 1099, 1614, 2776, 5684, 4060),
  n_bidders = c(30, 153, 104, 214, 67, 132, 57, 30),
  band = c("1.9 GHz", "1.9 GHz", "1.7/2.1 GHz", "700 MHz",
            "1.7/2.1 GHz", "600 MHz", "3.7 GHz", "3.45 GHz")
)

cat("\n=== Selected FCC Spectrum Auctions ===\n")
print(fcc_data)
```
## Static publication-ready figure
```{r}
#| label: fig-fcc-revenue
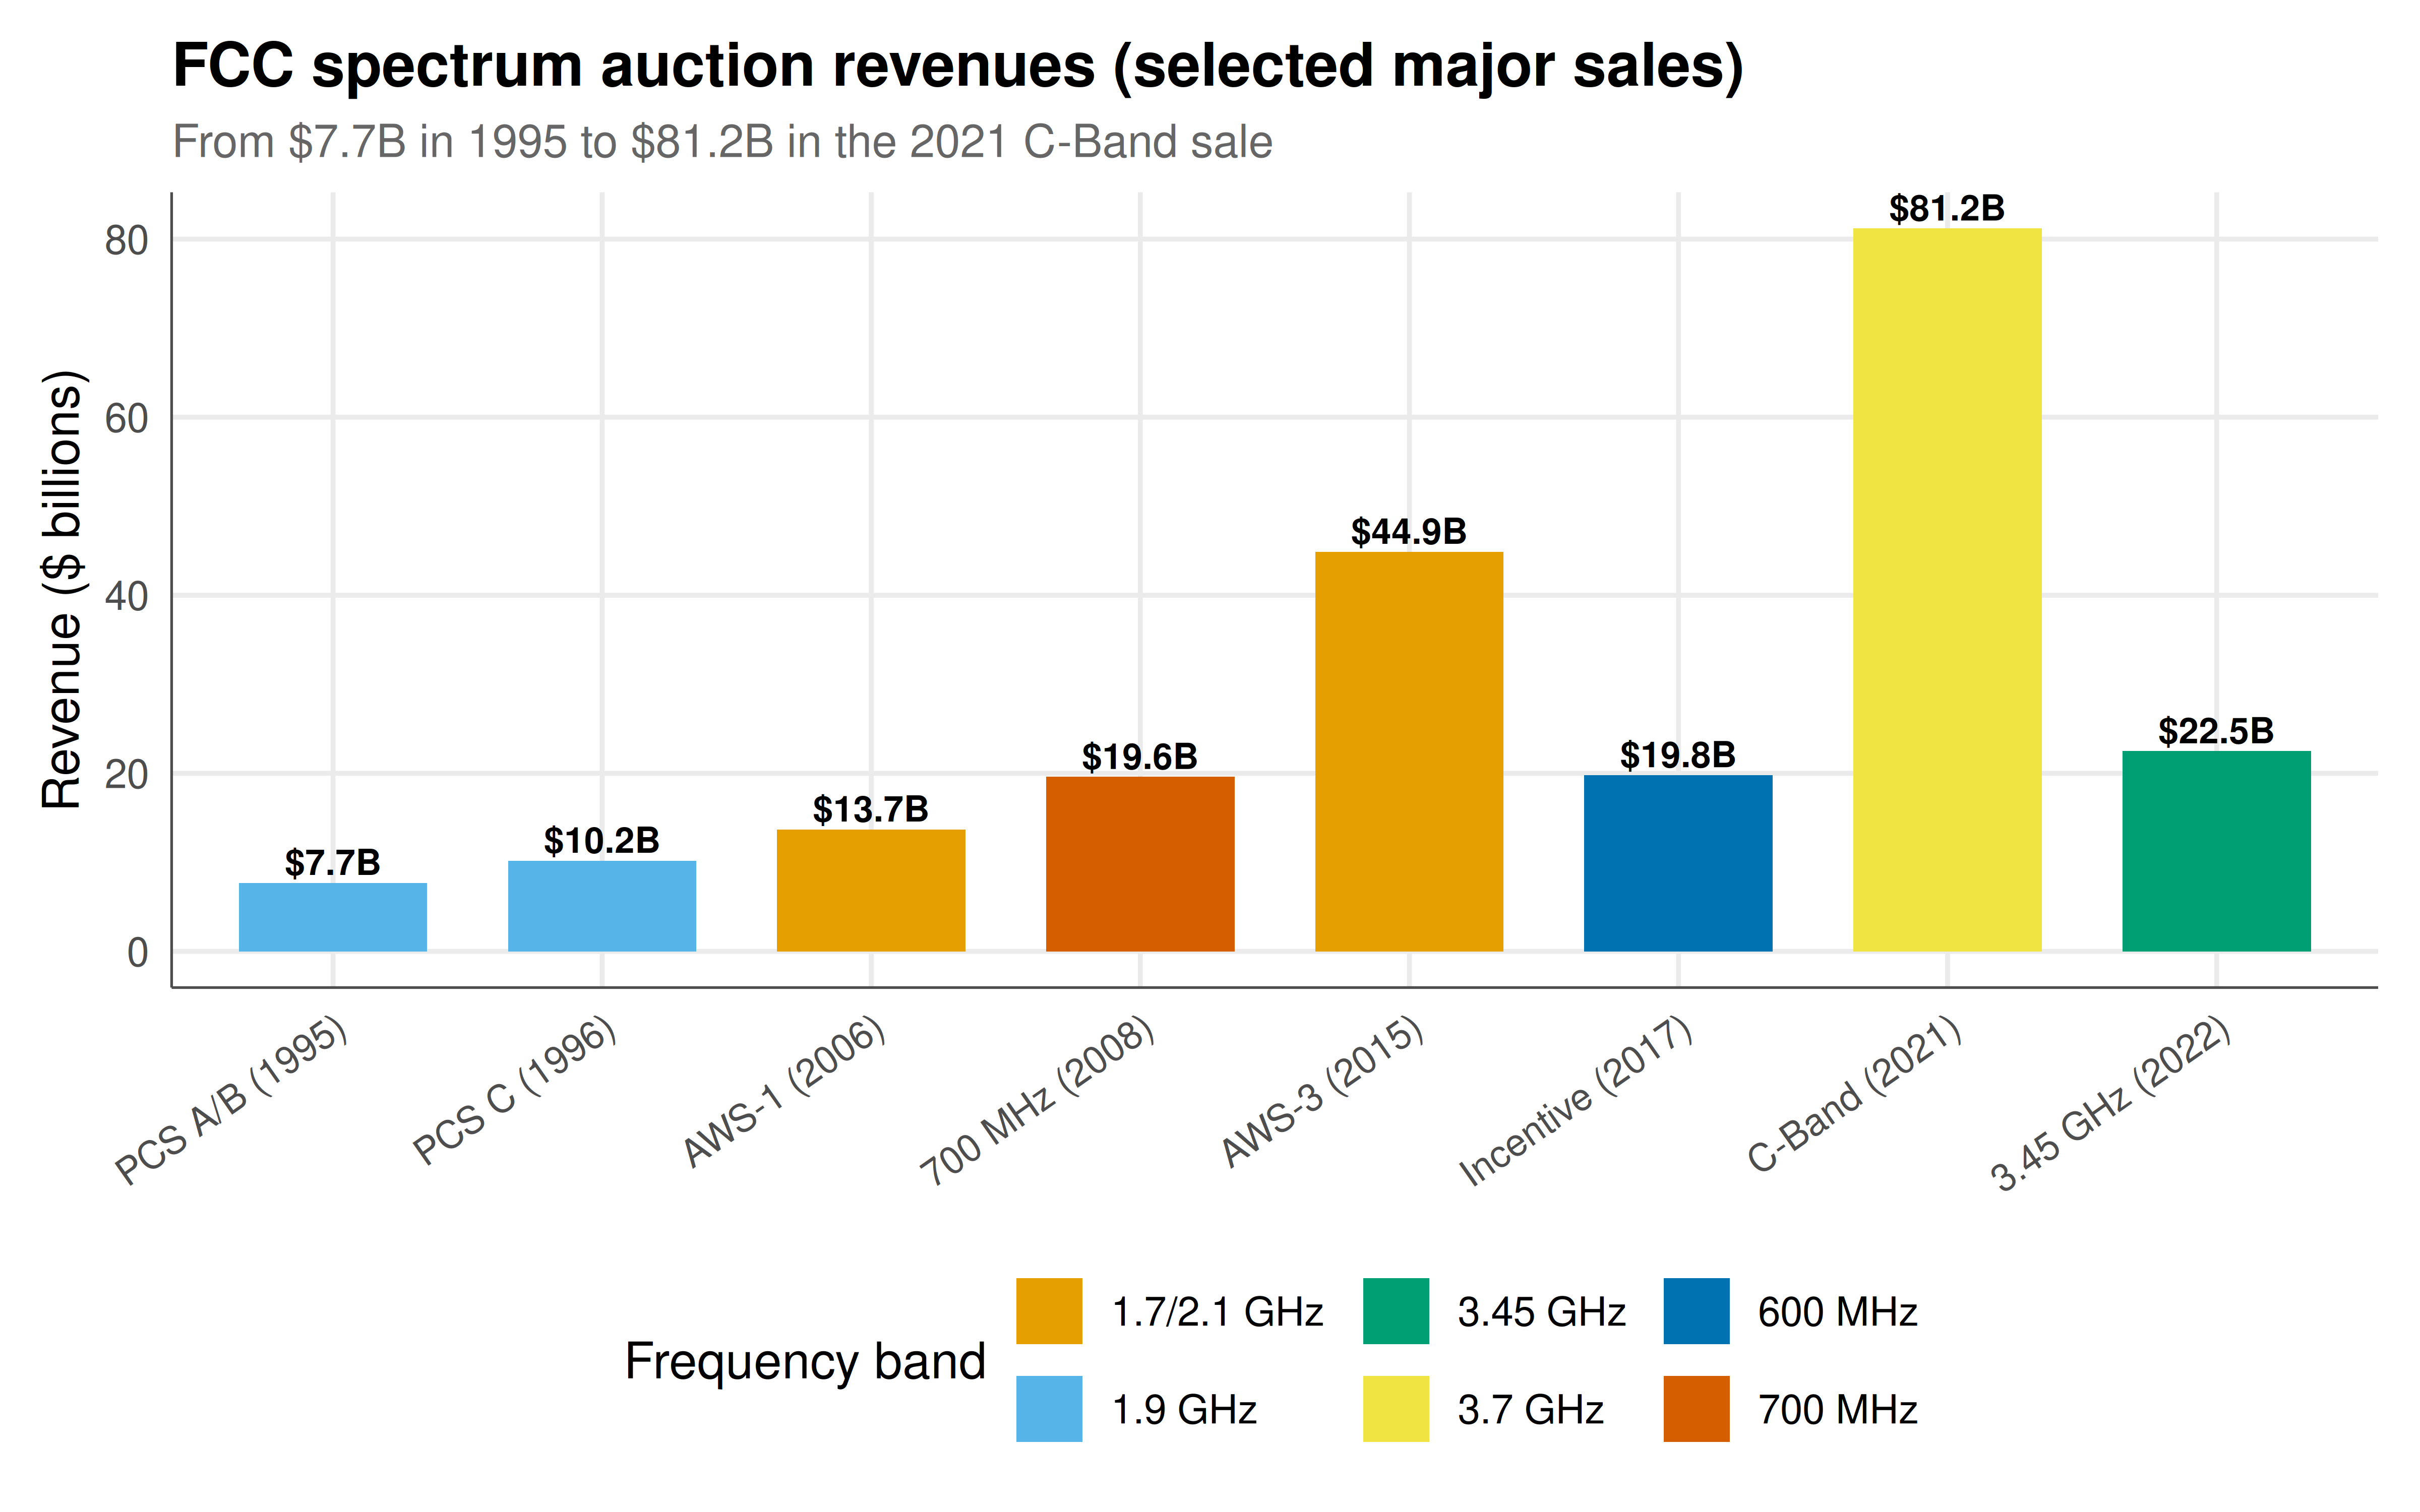
#| fig-cap: "Figure 1. Revenue from major FCC spectrum auctions (1995-2022). The C-Band auction of 2021 generated $81.2 billion, the largest auction in history, driven by demand for mid-band 5G spectrum. Auction revenues reflect both spectrum scarcity and design improvements including simultaneous ascending and combinatorial formats. Okabe-Ito palette."
#| dev: [png, pdf]
#| fig-width: 8
#| fig-height: 5
#| dpi: 300
fcc_data <- fcc_data |>
  mutate(auction = factor(auction, levels = auction))

p_fcc <- ggplot(fcc_data, aes(x = auction, y = revenue_bn, fill = band)) +
  geom_col(width = 0.7) +
  geom_text(aes(label = paste0("$", revenue_bn, "B")),
            vjust = -0.3, size = 3, fontface = "bold") +
  scale_fill_manual(values = okabe_ito[1:6], name = "Frequency band") +
  labs(
    title = "FCC spectrum auction revenues (selected major sales)",
    subtitle = "From $7.7B in 1995 to $81.2B in the 2021 C-Band sale",
    x = NULL,
    y = "Revenue ($ billions)"
  ) +
  theme_publication() +
  theme(axis.text.x = element_text(angle = 35, hjust = 1, size = 9))

p_fcc
```
## Interactive figure
```{r}
#| label: fig-smra-price-paths
# Visualize price trajectories from the SMRA simulation
history <- history |>
  mutate(text = paste0("Round: ", round,
                       "\nLicence: ", licence,
                       "\nPrice: $", price,
                       "\nBidder: ", bidder))

p_paths <- ggplot(history,
                  aes(x = round, y = price,
                      color = factor(licence), text = text)) +
  geom_step(linewidth = 0.9) +
  geom_point(size = 1.5, alpha = 0.7) +
  scale_color_manual(values = okabe_ito[1:4], name = "Licence") +
  labs(
    title = "SMRA simulation — price trajectories per licence",
    subtitle = "Simultaneous ascending bids with activity rules and synergy effects",
    x = "Auction round", y = "Current price ($)"
  ) +
  theme_publication()

ggplotly(p_paths, tooltip = "text") |>
  config(displaylogo = FALSE,
         modeBarButtonsToRemove = c("select2d", "lasso2d"))
```
## Interpretation
The FCC spectrum auctions demonstrate how careful mechanism design translates game theory into enormous economic value. The SMRA format solved the fundamental problem of selling related items: by keeping all licences open simultaneously, bidders could observe price trends, switch between substitute licences, and aggregate complements — reducing the exposure problem that plagued sequential formats. The simulation shows how prices evolve as bidders compete across multiple licences, with activity rules preventing strategic demand withholding. Historical data reveals an upward trend in total revenue driven by two forces: increasing scarcity of usable spectrum as wireless data demand explodes, and design improvements such as combinatorial bidding rules that allow more efficient expression of preferences. The 2021 C-Band auction's $81.2 billion record reflected fierce competition among Verizon, AT&T, and T-Mobile for mid-band 5G frequencies. However, the SMRA is not without flaws: the exposure problem remains for strong complementarities, tacit collusion through signalling in licence identifiers has been documented, and small bidders face budget constraints that large incumbents do not. The FCC's Incentive Auction of 2017 introduced a two-sided design (buying spectrum from broadcasters while selling to telecoms) that required solving an NP-hard repacking problem — illustrating how auction design pushed both economic theory and computer science to new frontiers. The success of the FCC model led to its adoption for spectrum sales in the UK (Ofcom), Germany (BNetzA), India, and dozens of other countries.
## Extensions & related tutorials
- [First-price sealed-bid auction](../../auction-theory-deep-dive/first-price-sealed-bid/) — foundations of auction equilibrium bidding.
- [Vickrey-Clarke-Groves mechanism](../../mechanism-design/vickrey-second-price-auction/) — truthful mechanism for combinatorial allocation.
- [Matching markets and stable allocation](../../mechanism-design/deferred-acceptance/) — another celebrated design application.
- [Common value auctions and the winner's curse](../../auction-theory-deep-dive/common-value-winners-curse/) — when values are interdependent.
- [Network effects and platform competition](../../network-games/platform-competition/) — the downstream market for spectrum.
## References
::: {#refs}
:::