27 Altmetrics
27.1 Learning objectives
After completing this chapter, you will be able to:
- Define altmetrics and explain how they complement citation-based indicators
- Retrieve altmetric-related data from OpenAlex (open access status, type, counts)
- Compute correlations between citation counts and alternative indicators
- Interpret altmetric signals critically — distinguishing attention from impact
- Discuss the limitations of altmetrics for research evaluation
27.3 Conceptual background
Citations measure one dimension of scholarly impact: influence on subsequent research. But scholarly work can also influence policy, education, clinical practice, and public understanding — none of which are captured by citation counts. Altmetrics (alternative metrics) attempt to fill this gap by tracking online traces of attention: social media mentions, news coverage, blog posts, Wikipedia citations, Mendeley reader counts, and policy document references.
The term was coined by Priem et al. (2010), who argued that the speed and diversity of online scholarly communication demanded new metrics beyond the Journal Impact Factor. Altmetrics are typically faster than citations (social media attention peaks within days of publication, while citations take years) and broader (they capture engagement by non-researchers).
However, altmetrics come with significant caveats. Social media attention correlates weakly with scientific quality. Metrics are easily gamed (bots, self-promotion). Coverage is uneven: biomedical research attracts far more Twitter/X attention than mathematics or engineering. And the platforms providing altmetric data (Altmetric.com, PlumX) are commercial products with proprietary algorithms (Hicks et al. 2015).
OpenAlex provides open-access status and citation counts but does not directly provide social media metrics. For altmetric data, external APIs (Altmetric.com, Crossref Event Data) are needed. In this chapter, we demonstrate what can be done with OpenAlex metadata alone and discuss how to extend the analysis with external sources.
27.4 Worked example
27.4.1 Fetching data with OA indicators
works <- oa_fetch(
  entity = "works",
  primary_location.source.id = "S148561398",
  from_publication_date = "2020-01-01",
  to_publication_date = "2023-12-31",
  options = list(sample = 400, seed = 42)
)

works_slim <- works |>
  transmute(
    id, display_name,
    year = year(publication_date),
    cited_by_count,
    oa_status = oa_status,
    type,
    referenced_works_count
  )

cat(glue("Works retrieved: {nrow(works_slim)}\n"))
#> Works retrieved: 40027.4.2 Open access as an altmetric dimension
oa_summary <- works_slim |>
  count(oa_status, sort = TRUE) |>
  mutate(pct = scales::percent(n / sum(n)))

oa_summary |> gt()| oa_status | n | pct |
|---|---|---|
| closed | 206 | 51.5% |
| hybrid | 115 | 28.8% |
| green | 42 | 10.5% |
| bronze | 37 | 9.2% |
works_slim |>
  filter(!is.na(oa_status)) |>
  ggplot(aes(x = oa_status, y = cited_by_count + 1)) +
  geom_boxplot(fill = palette_sci(1), alpha = 0.7) +
  scale_y_log10() +
  labs(x = "OA status", y = "Citations (log scale)") +
  theme_sci()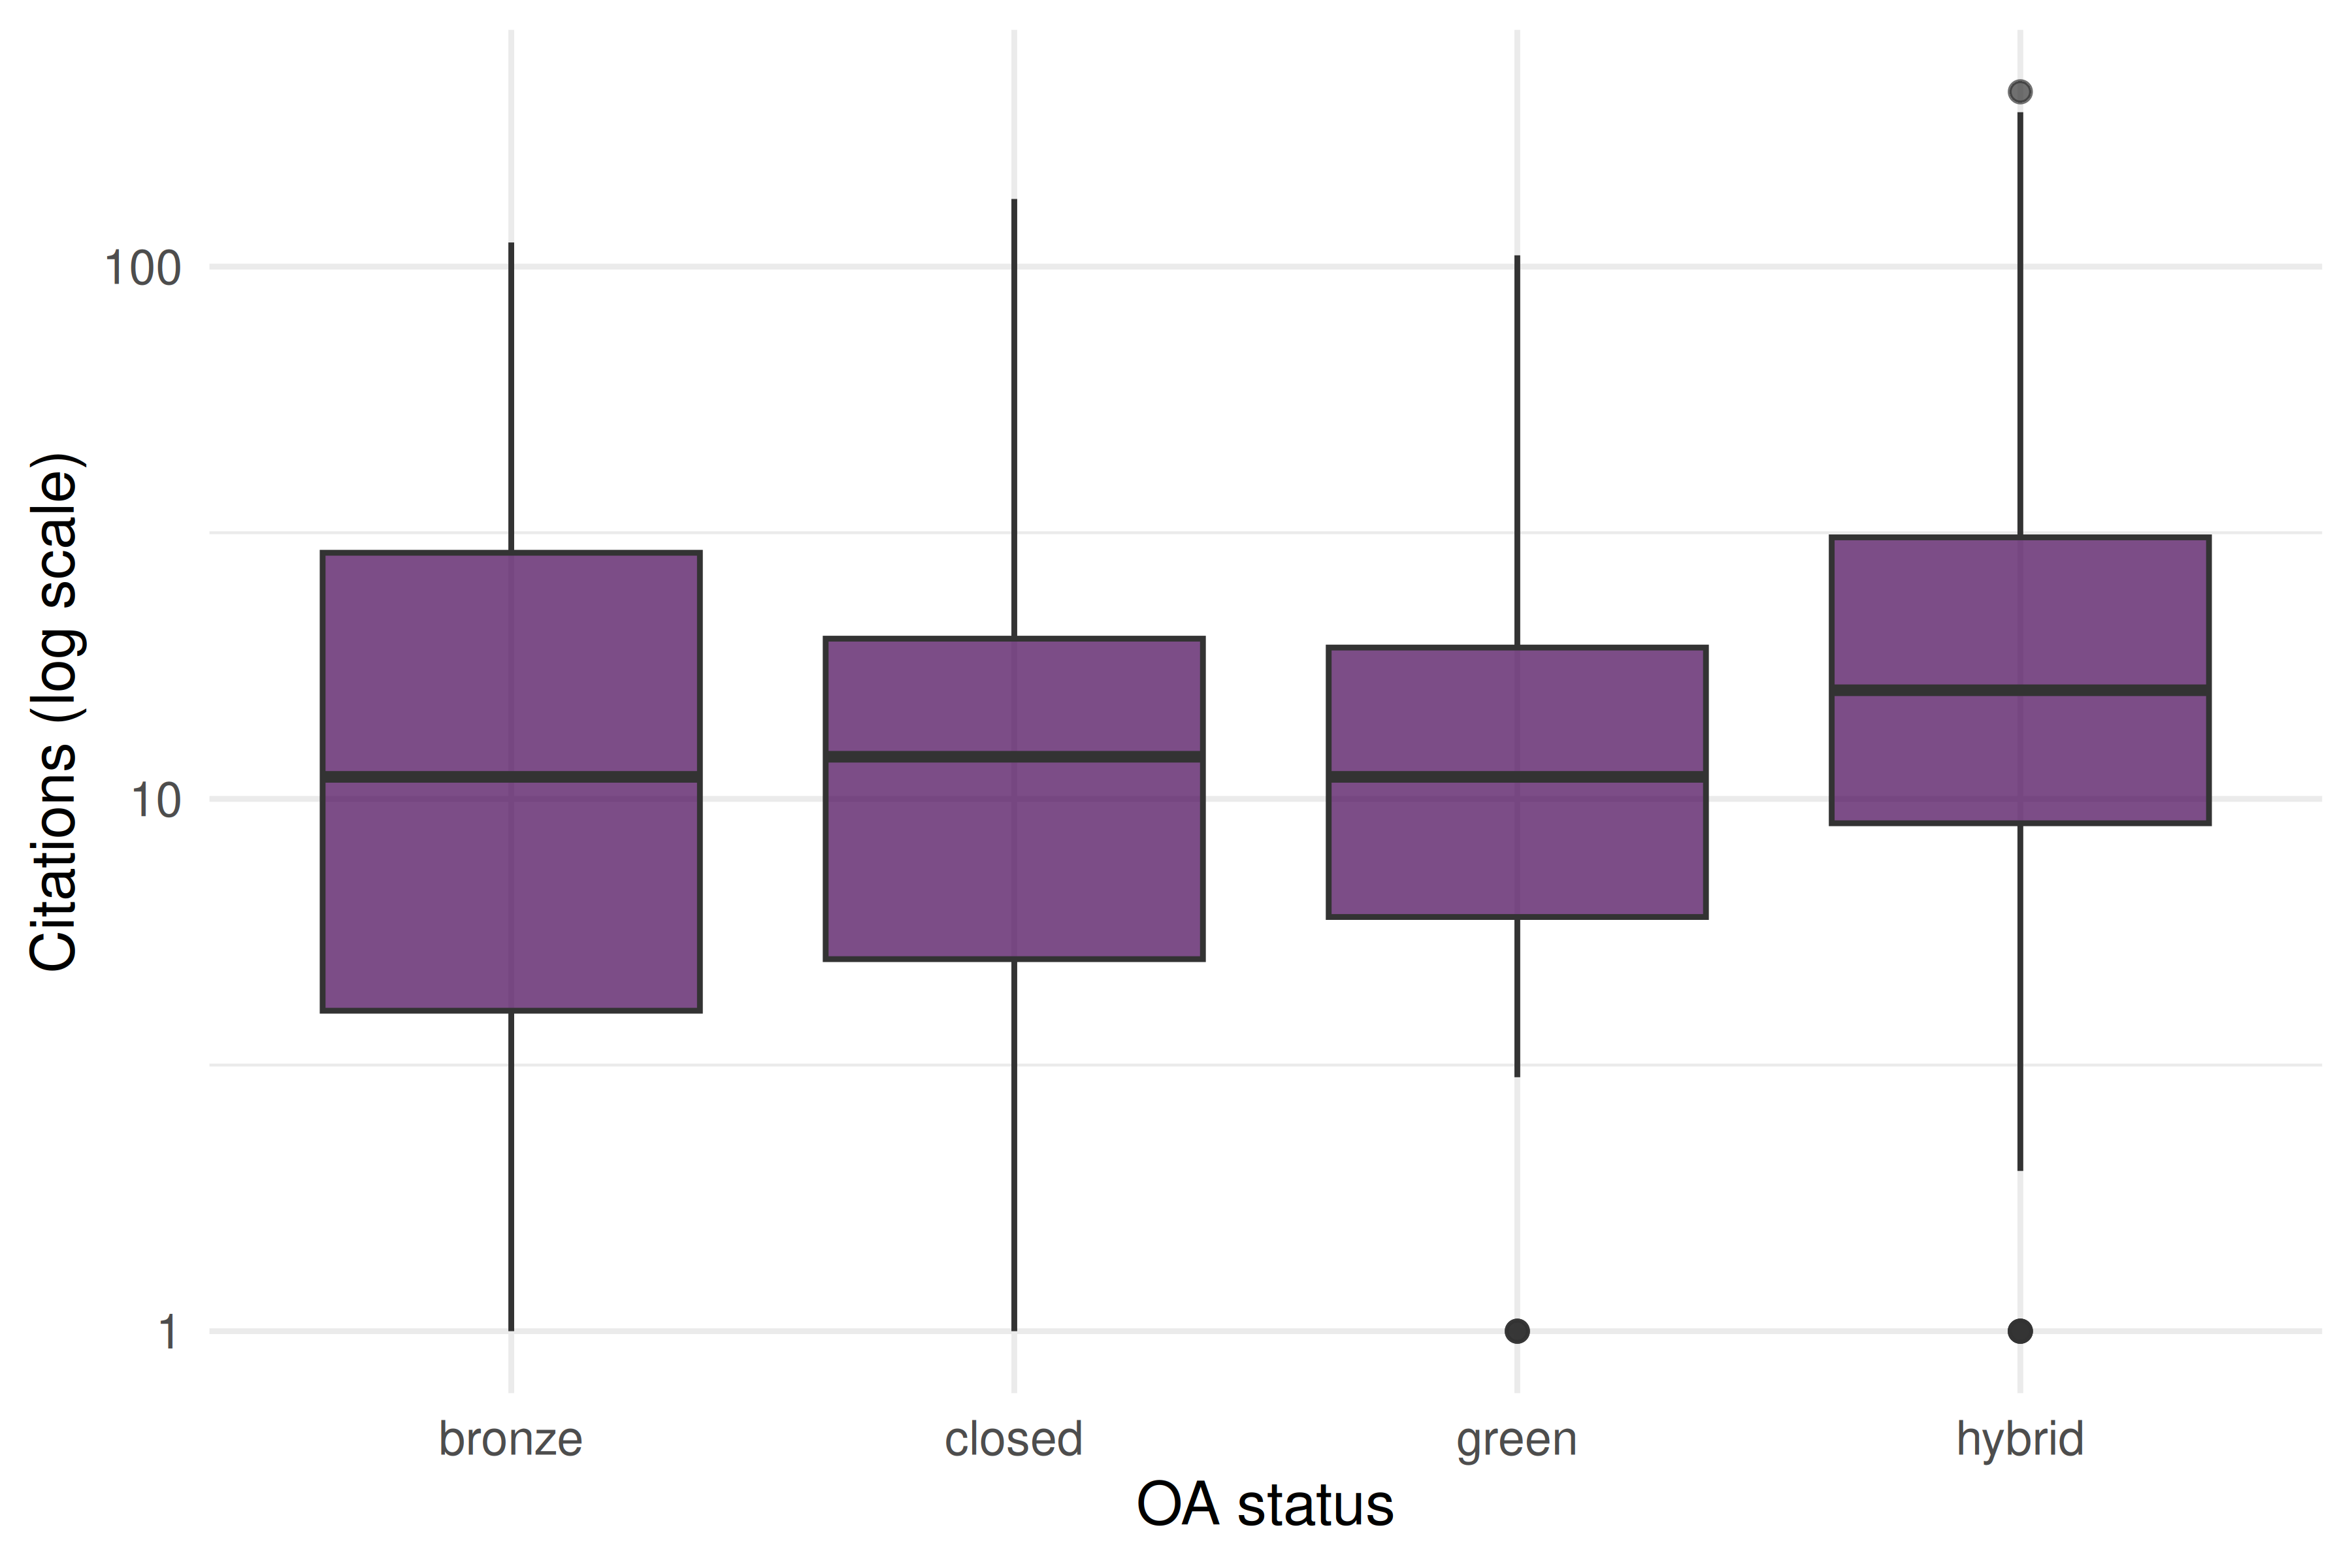
Figure 27.1: Citation distributions by open access status.
27.4.3 Citation count distribution
ggplot(works_slim, aes(x = cited_by_count)) +
  geom_histogram(binwidth = 5, fill = palette_sci(1), colour = "white") +
  labs(x = "Citation count", y = "Number of papers") +
  theme_sci()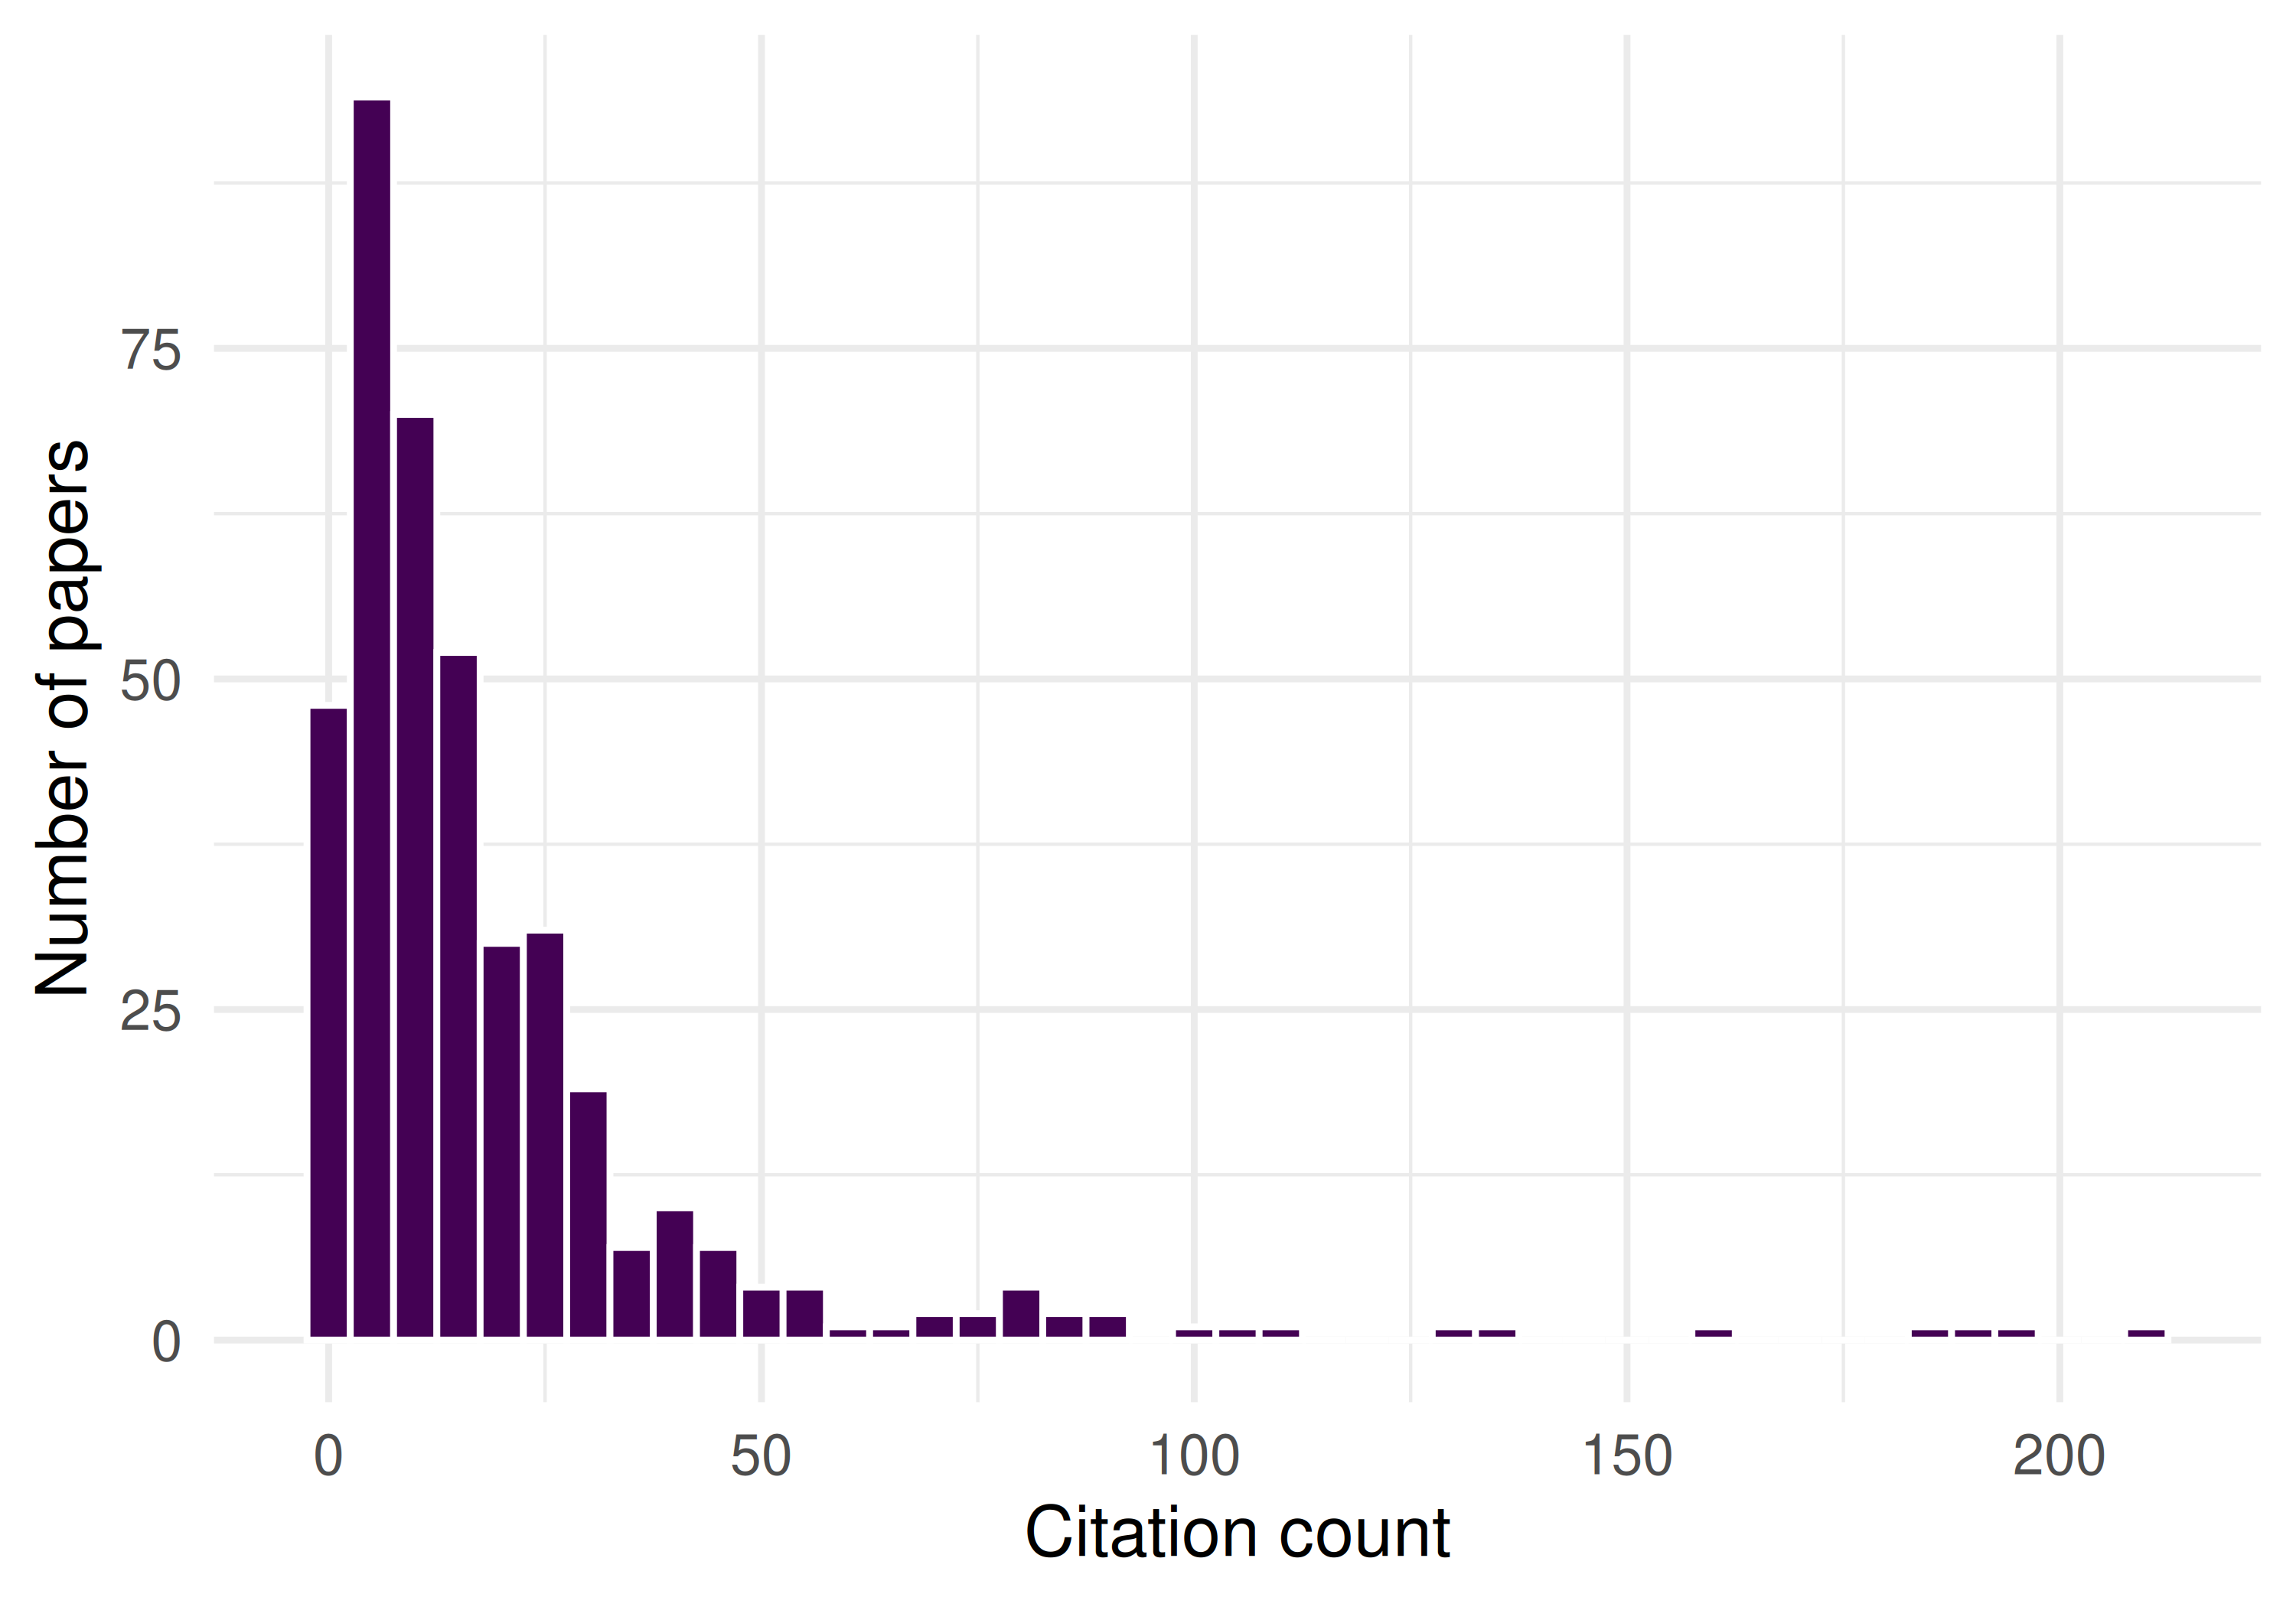
Figure 27.2: Citation distribution of the sample, showing the characteristic right skew.
27.4.4 Proxy altmetric: reference list length
Reference list length correlates with engagement breadth and can serve as a simple proxy for scholarly thoroughness.
ggplot(works_slim, aes(x = referenced_works_count, y = cited_by_count)) +
  geom_point(alpha = 0.3, colour = palette_sci(1)) +
  geom_smooth(method = "lm", se = FALSE, colour = palette_sci(2)[2]) +
  labs(x = "Number of references", y = "Citation count") +
  theme_sci()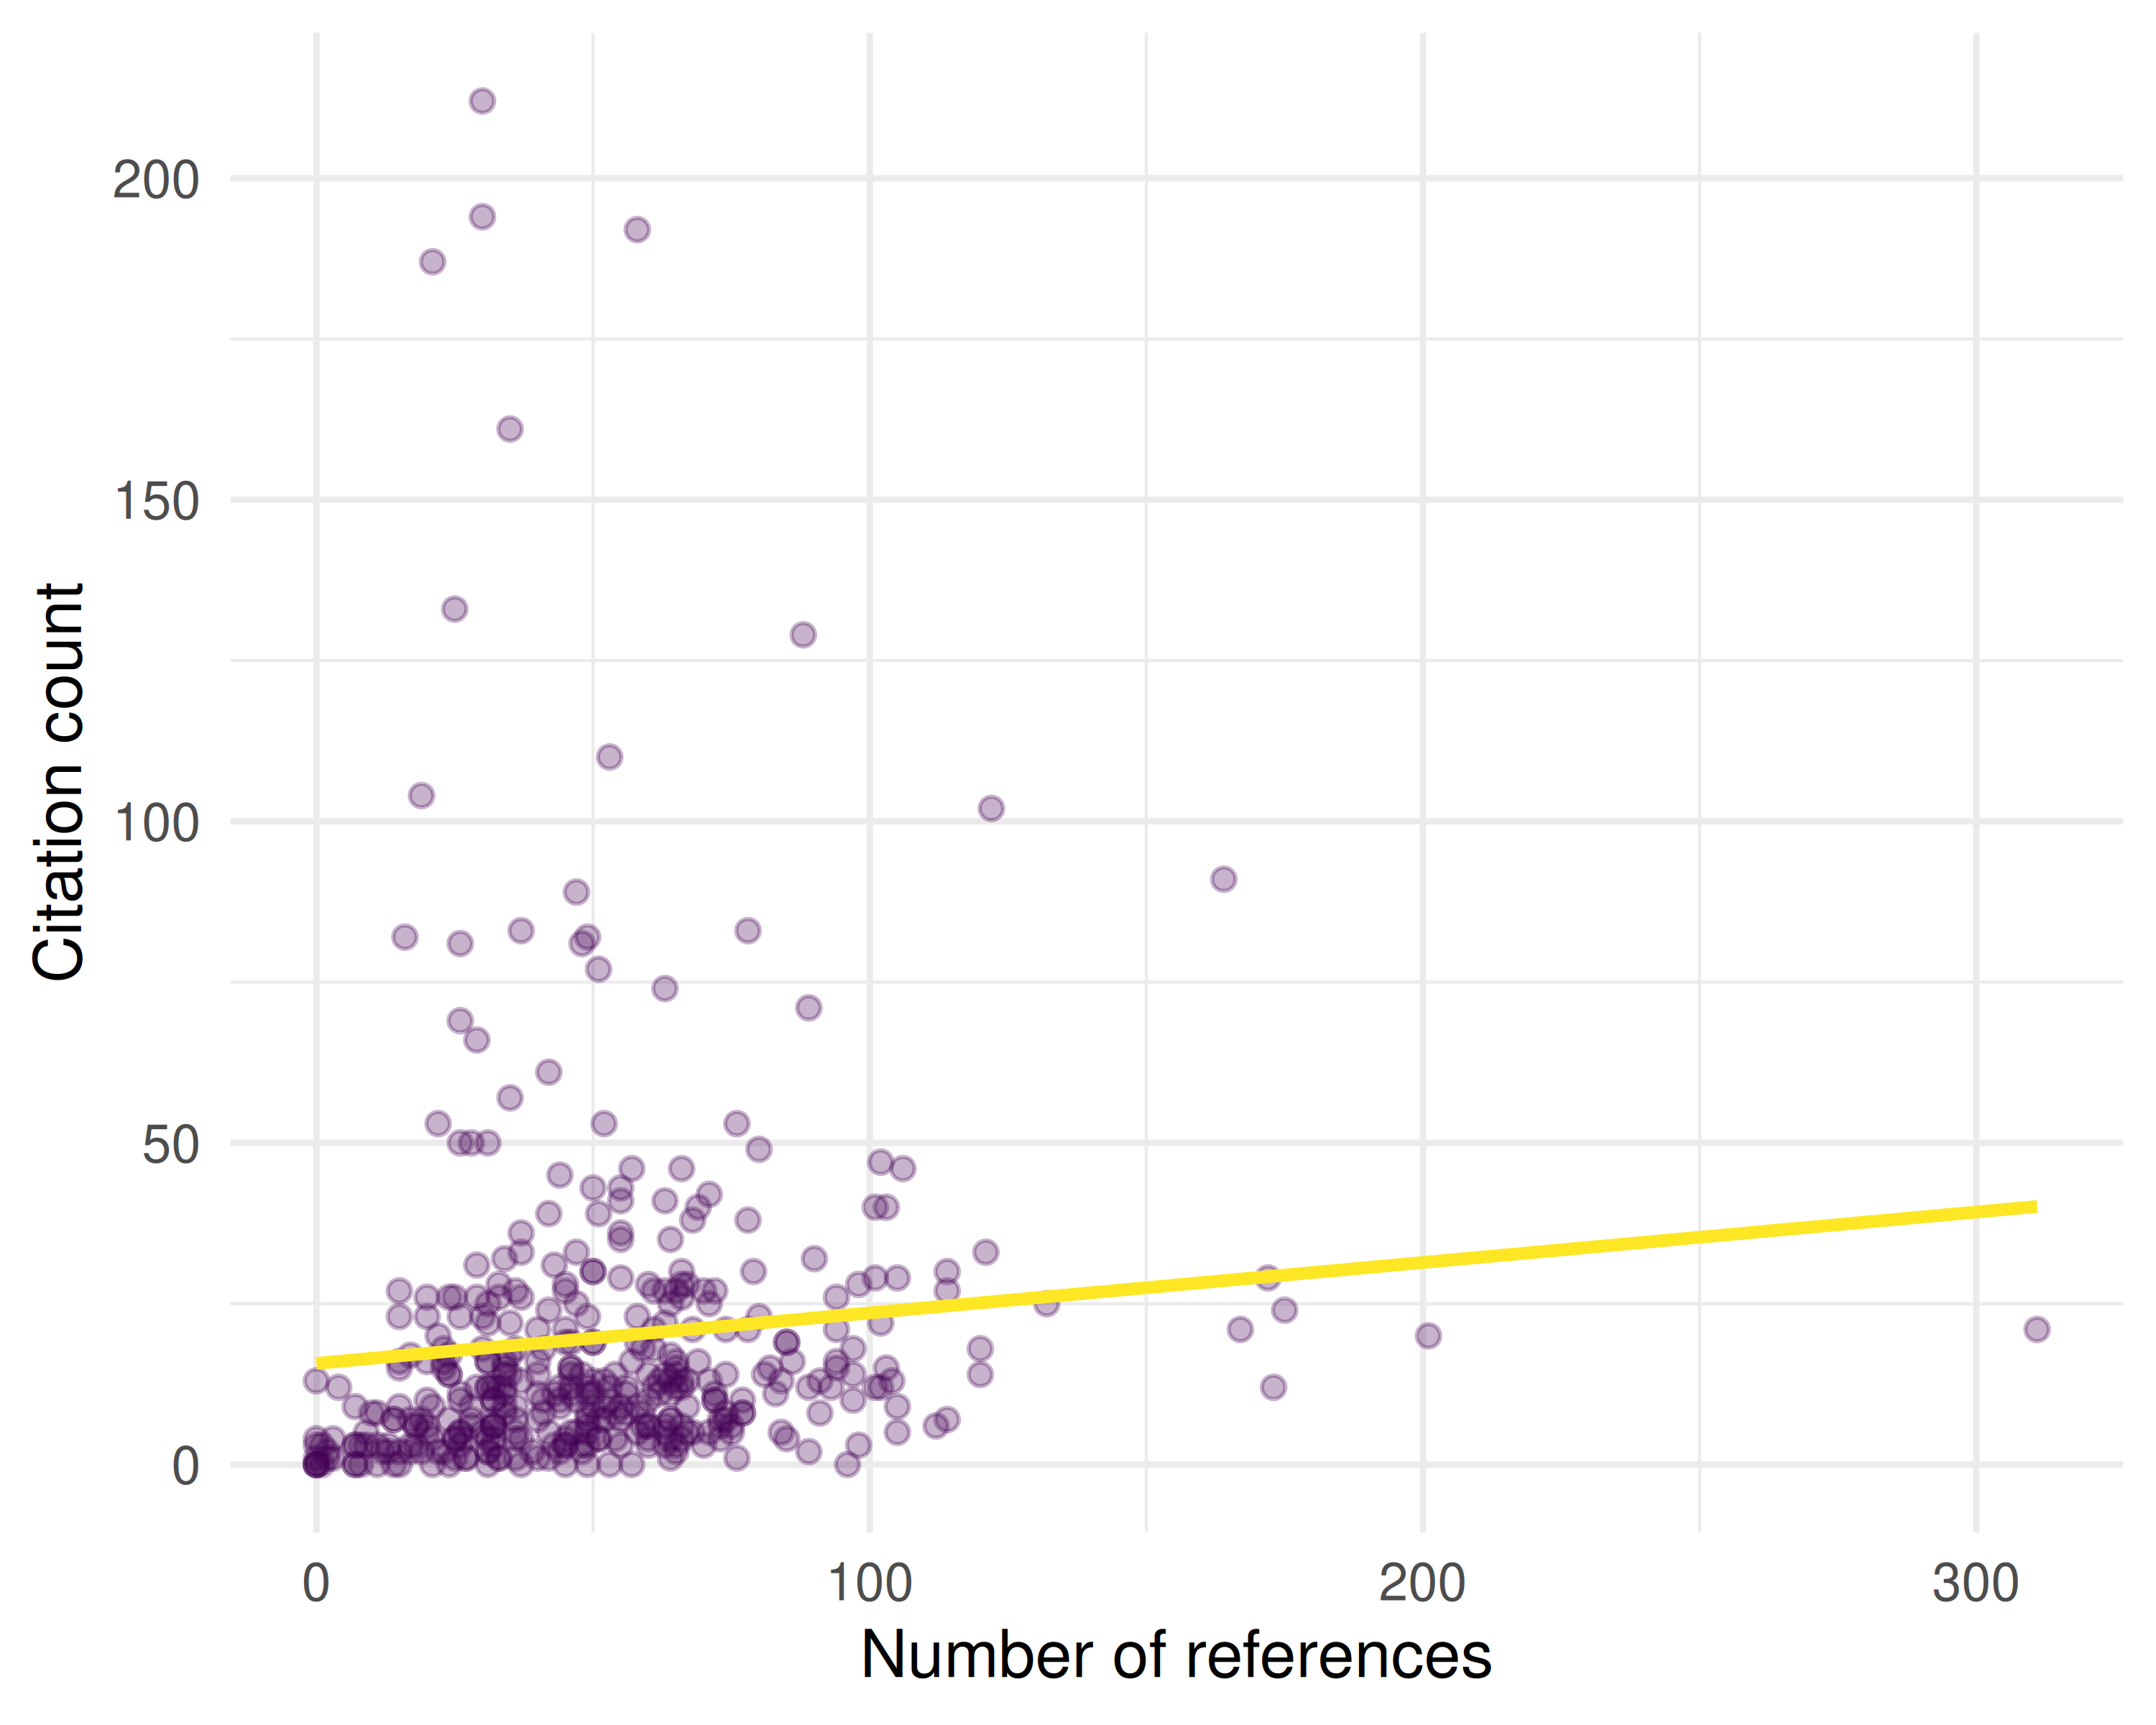
Figure 27.3: Relationship between reference list length and citation count.
cor_val <- cor(works_slim$referenced_works_count, works_slim$cited_by_count,
               use = "complete.obs")
cat(glue("Pearson correlation (references vs. citations): {round(cor_val, 3)}\n"))
#> Pearson correlation (references vs. citations): 0.22327.5 Diagnostics and interpretation
- OA advantage: Open-access articles often receive more citations, but this may reflect self-selection (higher-quality papers are more likely to be made OA) rather than the causal effect of open access.
- Platform coverage: Social media altmetrics are biased toward English-language, biomedical, and controversial topics. Low altmetric scores do not indicate low impact.
- Temporal dynamics: Altmetric attention peaks immediately after publication and decays rapidly. Citations follow a slower, more sustained trajectory.
- Gaming risk: Social media metrics are more easily manipulated than citations. Interpret high altmetric scores with caution.
27.7 Limitations and responsible use
- Attention ≠ impact. A viral tweet about a paper does not mean the paper is scientifically significant. Altmetrics measure visibility, not quality (Hicks et al. 2015).
- Disciplinary bias. Fields with active social media communities (public health, climate science) generate far more altmetric data than fields that do not (pure mathematics, medieval history).
- Platform dependence. Altmetric data depends on commercial platforms whose coverage, algorithms, and existence are not guaranteed.
- Never use altmetrics for individual evaluation. The Leiden Manifesto and DORA both caution against using any single metric — including altmetrics — as a proxy for research quality (American Society for Cell Biology 2012).
27.9 Common pitfalls
- Treating Mendeley readers as “citations.” Mendeley reader counts reflect who saved a paper, not who cited it. The overlap is partial.
- Comparing altmetrics across fields. A paper in public health with 50 tweets is unremarkable; the same count in algebraic topology is extraordinary.
- Ignoring bots and self-promotion. Some social media mentions are from automated accounts or coordinated campaigns. Commercial altmetric services attempt to filter these, but coverage is imperfect.
- Confusing the Altmetric Attention Score with a quality indicator. The score is a weighted sum of online mentions, not a peer-reviewed quality assessment.
27.10 Exercises
OA citation advantage. For two journals with different OA rates, compare mean citations for OA vs. closed-access papers. Is the “OA advantage” consistent across journals?
Temporal attention. For a set of recent papers, track how citation counts change between 6 months and 2 years after publication. Do papers with high early attention (many references, rapid initial citations) sustain their advantage?
Cross-field comparison. Fetch samples from a biomedical journal and a mathematics journal. Compare their citation distributions and reference list lengths. What does this suggest about field-specific attention patterns?
27.11 Solutions
Solutions are provided in 2.11.
27.12 Further reading
- Priem et al. (2010) — The altmetrics manifesto: the original call for alternative impact measures.
- Hicks et al. (2015) — The Leiden Manifesto: responsible metrics, including cautions about altmetrics.
- American Society for Cell Biology (2012) — DORA: principles for research assessment beyond the JIF.
- Priem et al. (2022) — OpenAlex open-access classification and metadata.
27.13 Session info
#> R version 4.4.1 (2024-06-14)
#> Platform: x86_64-pc-linux-gnu
#> Running under: Ubuntu 24.04.4 LTS
#>
#> Matrix products: default
#> BLAS:   /usr/lib/x86_64-linux-gnu/openblas-pthread/libblas.so.3
#> LAPACK: /usr/lib/x86_64-linux-gnu/openblas-pthread/libopenblasp-r0.3.26.so;  LAPACK version 3.12.0
#>
#> locale:
#>  [1] LC_CTYPE=C.UTF-8       LC_NUMERIC=C           LC_TIME=C.UTF-8
#>  [4] LC_COLLATE=C.UTF-8     LC_MONETARY=C.UTF-8    LC_MESSAGES=C.UTF-8
#>  [7] LC_PAPER=C.UTF-8       LC_NAME=C              LC_ADDRESS=C
#> [10] LC_TELEPHONE=C         LC_MEASUREMENT=C.UTF-8 LC_IDENTIFICATION=C
#>
#> time zone: UTC
#> tzcode source: system (glibc)
#>
#> attached base packages:
#> [1] stats     graphics  grDevices utils     datasets  methods   base
#>
#> other attached packages:
#>  [1] uwot_0.2.4                Matrix_1.7-0
#>  [3] word2vec_0.4.1            stm_1.3.8
#>  [5] topicmodels_0.2-17        quanteda.textstats_0.97.2
#>  [7] visNetwork_2.1.4          ggraph_2.2.2
#>  [9] tidygraph_1.3.1           igraph_2.3.2
#> [11] quanteda_4.4              pdftools_3.9.0
#> [13] arrow_24.0.0              bibliometrix_5.4.0
#> [15] RefManageR_1.4.0          bib2df_1.1.2.0
#> [17] rcrossref_1.2.1           gt_1.3.0
#> [19] tidytext_0.4.3            glue_1.8.1
#> [21] openalexR_3.0.1           lubridate_1.9.5
#> [23] forcats_1.0.1             stringr_1.6.0
#> [25] dplyr_1.2.1               purrr_1.2.2
#> [27] readr_2.2.0               tidyr_1.3.2
#> [29] tibble_3.3.1              ggplot2_4.0.3
#> [31] tidyverse_2.0.0
#>
#> loaded via a namespace (and not attached):
#>   [1] bibtex_0.5.2           RColorBrewer_1.1-3     rstudioapi_0.18.0
#>   [4] jsonlite_2.0.0         magrittr_2.0.5         modeltools_0.2-24
#>   [7] farver_2.1.2           rmarkdown_2.31         fs_2.1.0
#>  [10] vctrs_0.7.3            memoise_2.0.1          askpass_1.2.1
#>  [13] base64enc_0.1-6        htmltools_0.5.9        contentanalysis_1.0.0
#>  [16] curl_7.1.0             janeaustenr_1.0.0      cellranger_1.1.0
#>  [19] sass_0.4.10            bslib_0.11.0           htmlwidgets_1.6.4
#>  [22] tokenizers_0.3.0       plyr_1.8.9             httr2_1.2.2
#>  [25] plotly_4.12.0          cachem_1.1.0           dimensionsR_0.0.3
#>  [28] mime_0.13              lifecycle_1.0.5        pkgconfig_2.0.3
#>  [31] R6_2.6.1               fastmap_1.2.0          shiny_1.13.0
#>  [34] digest_0.6.39          patchwork_1.3.2        shinycssloaders_1.1.0
#>  [37] rprojroot_2.1.1        RSpectra_0.16-2        SnowballC_0.7.1
#>  [40] labeling_0.4.3         urltools_1.7.3.1       timechange_0.4.0
#>  [43] mgcv_1.9-1             polyclip_1.10-7        httr_1.4.8
#>  [46] compiler_4.4.1         here_1.0.2             bit64_4.8.0
#>  [49] withr_3.0.2            S7_0.2.2               backports_1.5.1
#>  [52] viridis_0.6.5          ggforce_0.5.0          MASS_7.3-60.2
#>  [55] rappdirs_0.3.4         bibliometrixData_0.3.0 tools_4.4.1
#>  [58] otel_0.2.0             stopwords_2.3          zip_2.3.3
#>  [61] httpuv_1.6.17          rentrez_1.2.4          nlme_3.1-164
#>  [64] promises_1.5.0         grid_4.4.1             stringdist_0.9.17
#>  [67] reshape2_1.4.5         generics_0.1.4         gtable_0.3.6
#>  [70] tzdb_0.5.0             rscopus_0.9.0          ca_0.71.1
#>  [73] data.table_1.18.4      hms_1.1.4              xml2_1.5.2
#>  [76] utf8_1.2.6             ggrepel_0.9.8          pillar_1.11.1
#>  [79] nsyllable_1.0.1        vroom_1.7.1            later_1.4.8
#>  [82] splines_4.4.1          tweenr_2.0.3           brand.yml_0.1.0
#>  [85] lattice_0.22-6         FNN_1.1.4.1            bit_4.6.0
#>  [88] tidyselect_1.2.1       tm_0.7-18              miniUI_0.1.2
#>  [91] downlit_0.4.5          knitr_1.51             gridExtra_2.3
#>  [94] NLP_0.3-2              bookdown_0.46          stats4_4.4.1
#>  [97] crul_1.6.0             xfun_0.57              graphlayouts_1.2.3
#> [100] matrixStats_1.5.0      DT_0.34.0              humaniformat_0.6.0
#> [103] stringi_1.8.7          lazyeval_0.2.3         qpdf_1.4.1
#> [106] yaml_2.3.12            evaluate_1.0.5         codetools_0.2-20
#> [109] httpcode_0.3.0         cli_3.6.6              xtable_1.8-8
#> [112] jquerylib_0.1.4        dichromat_2.0-0.1      Rcpp_1.1.1-1.1
#> [115] readxl_1.4.5           triebeard_0.4.1        XML_3.99-0.23
#> [118] parallel_4.4.1         assertthat_0.2.1       pubmedR_1.0.2
#> [121] slam_0.1-55            viridisLite_0.4.3      scales_1.4.0
#> [124] crayon_1.5.3           openxlsx_4.2.8.1       rlang_1.2.0
#> [127] fastmatch_1.1-8