30 Retraction Analysis
30.1 Learning objectives
After completing this chapter, you will be able to:
- Identify retracted works in OpenAlex using type and metadata filters
- Analyse retraction rates by year, journal, and field
- Examine citation patterns before and after retraction
- Discuss the limitations of bibliometric approaches to research integrity
- Explain why retracted papers continue to accumulate citations
30.3 Conceptual background
Retraction is the formal mechanism by which the scholarly record corrects itself. A paper is retracted when it is found to contain fabricated data, serious errors, plagiarism, or ethical violations. In theory, retraction should halt the influence of flawed work. In practice, retracted papers continue to be cited — sometimes for years or decades after retraction.
The growth in retractions has been dramatic: from a few dozen per year in the 1990s to over 10,000 in recent years. This increase reflects both more misconduct detection (plagiarism software, image forensics) and more publications overall. Retraction rates vary by field: biomedical sciences have the highest absolute numbers, partly because of larger publication volumes and greater scrutiny.
Citation persistence is the most studied bibliometric aspect of retractions. Studies consistently find that retracted papers continue to accumulate positive citations (i.e., citations that treat the retracted work as valid) long after retraction. This occurs because: (1) citing authors may not be aware of the retraction; (2) database retraction notices are inconsistently displayed; (3) citations in already-published papers are not retroactively removed.
OpenAlex marks retracted works with a specific type or retraction flag, though coverage depends on publisher reporting. The Retraction Watch database provides the most comprehensive curated list of retractions but is not directly integrated into most bibliometric databases.
Bibliometric analysis of retractions must be approached carefully. The goal is to improve the self-correction mechanism, not to stigmatise individuals or institutions.
30.4 Worked example
30.4.1 Finding retracted works
retracted <- oa_fetch(
  entity = "works",
  is_retracted = "true",
  from_publication_date = "2010-01-01",
  to_publication_date = "2023-12-31",
  options = list(sample = 200, seed = 42)
)

cat(glue("Retracted works retrieved: {nrow(retracted)}\n"))
#> Retracted works retrieved: 200
retraction_years <- retracted |>
  mutate(year = year(publication_date)) |>
  count(year, sort = FALSE)

retraction_years |> gt()| year | n |
|---|---|
| 2010 | 4 |
| 2011 | 5 |
| 2012 | 1 |
| 2013 | 8 |
| 2014 | 5 |
| 2015 | 7 |
| 2016 | 5 |
| 2017 | 6 |
| 2018 | 13 |
| 2019 | 6 |
| 2020 | 21 |
| 2021 | 35 |
| 2022 | 42 |
| 2023 | 42 |
30.4.2 Citation counts of retracted papers
ggplot(retracted, aes(x = cited_by_count)) +
  geom_histogram(binwidth = 5, fill = palette_sci(1), colour = "white") +
  labs(x = "Citations received", y = "Number of retracted papers") +
  theme_sci()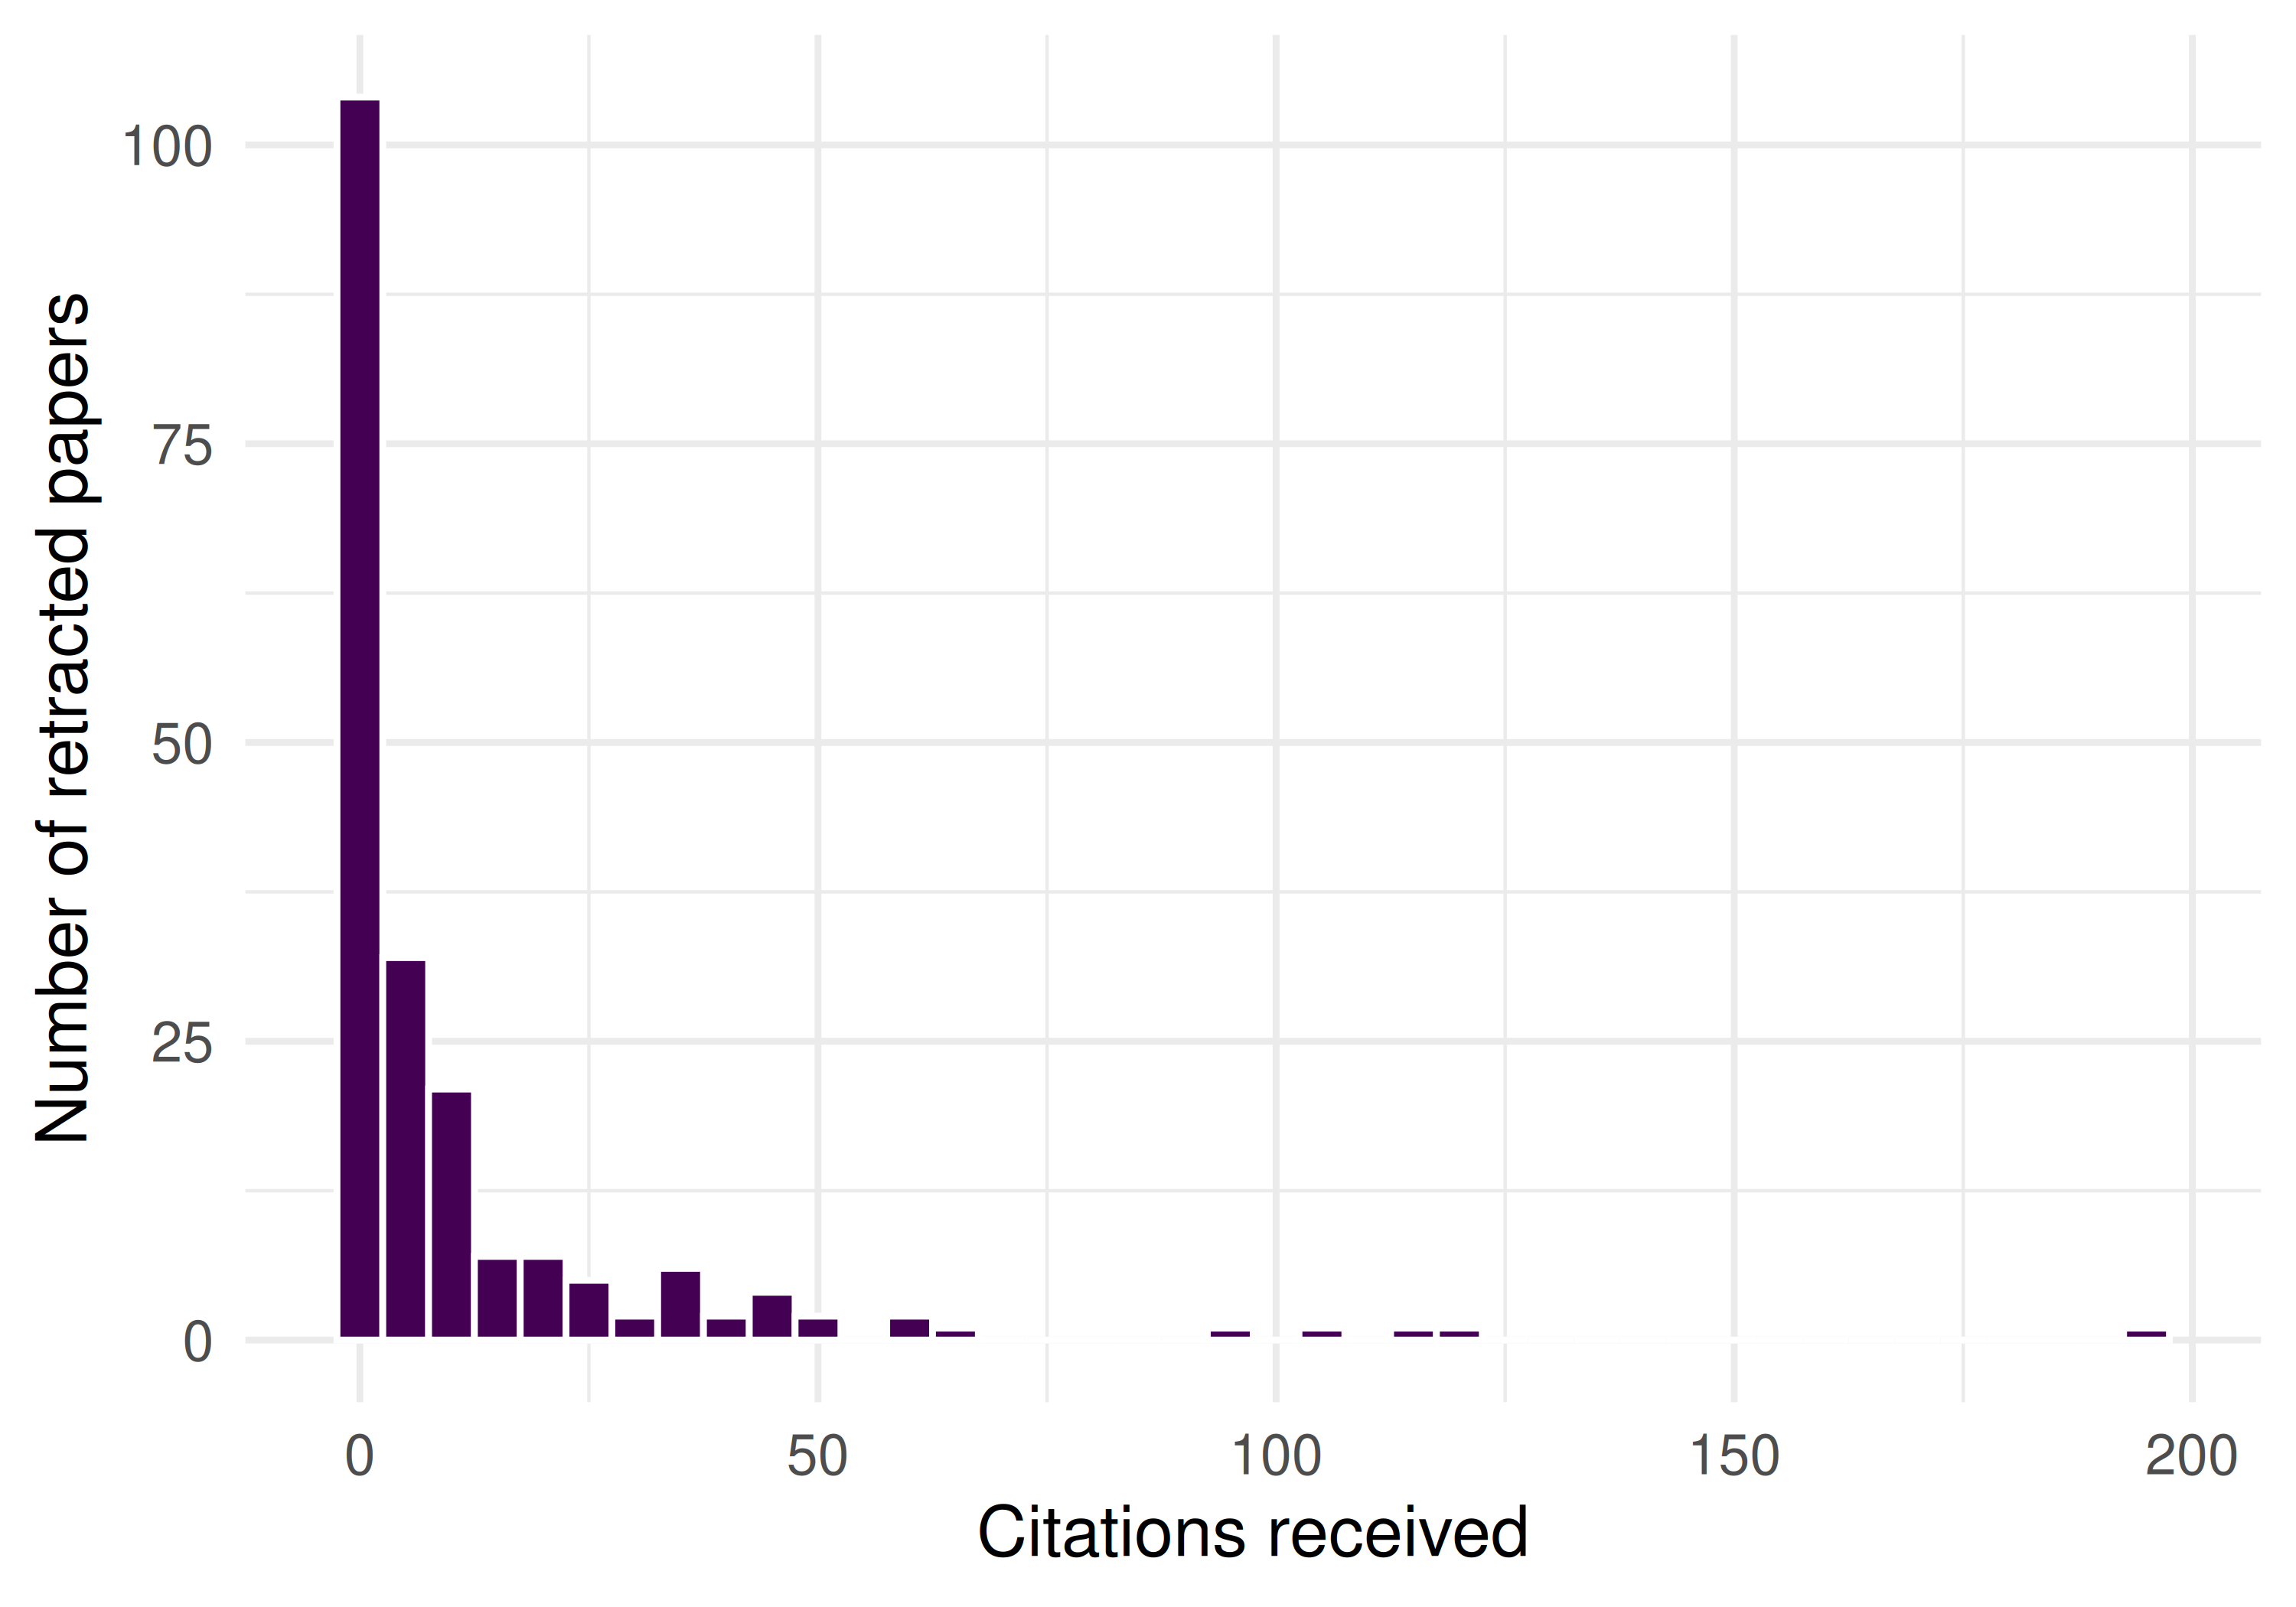
Figure 30.1: Citation count distribution of retracted papers.
cite_stats <- retracted |>
  summarise(
    n = n(),
    mean_cites = round(mean(cited_by_count), 1),
    median_cites = median(cited_by_count),
    max_cites = max(cited_by_count),
    pct_uncited = scales::percent(mean(cited_by_count == 0))
  )

cite_stats |> gt()| n | mean_cites | median_cites | max_cites | pct_uncited |
|---|---|---|---|---|
| 200 | 10.8 | 2 | 245 | 36% |
30.4.3 Retracted papers by source
retracted |>
  filter(!is.na(source_display_name)) |>
  count(source_display_name, sort = TRUE) |>
  head(10) |>
  mutate(source_display_name = fct_reorder(source_display_name, n)) |>
  ggplot(aes(x = n, y = source_display_name)) +
  geom_col(fill = palette_sci(1)) +
  labs(x = "Retracted papers", y = NULL) +
  theme_sci()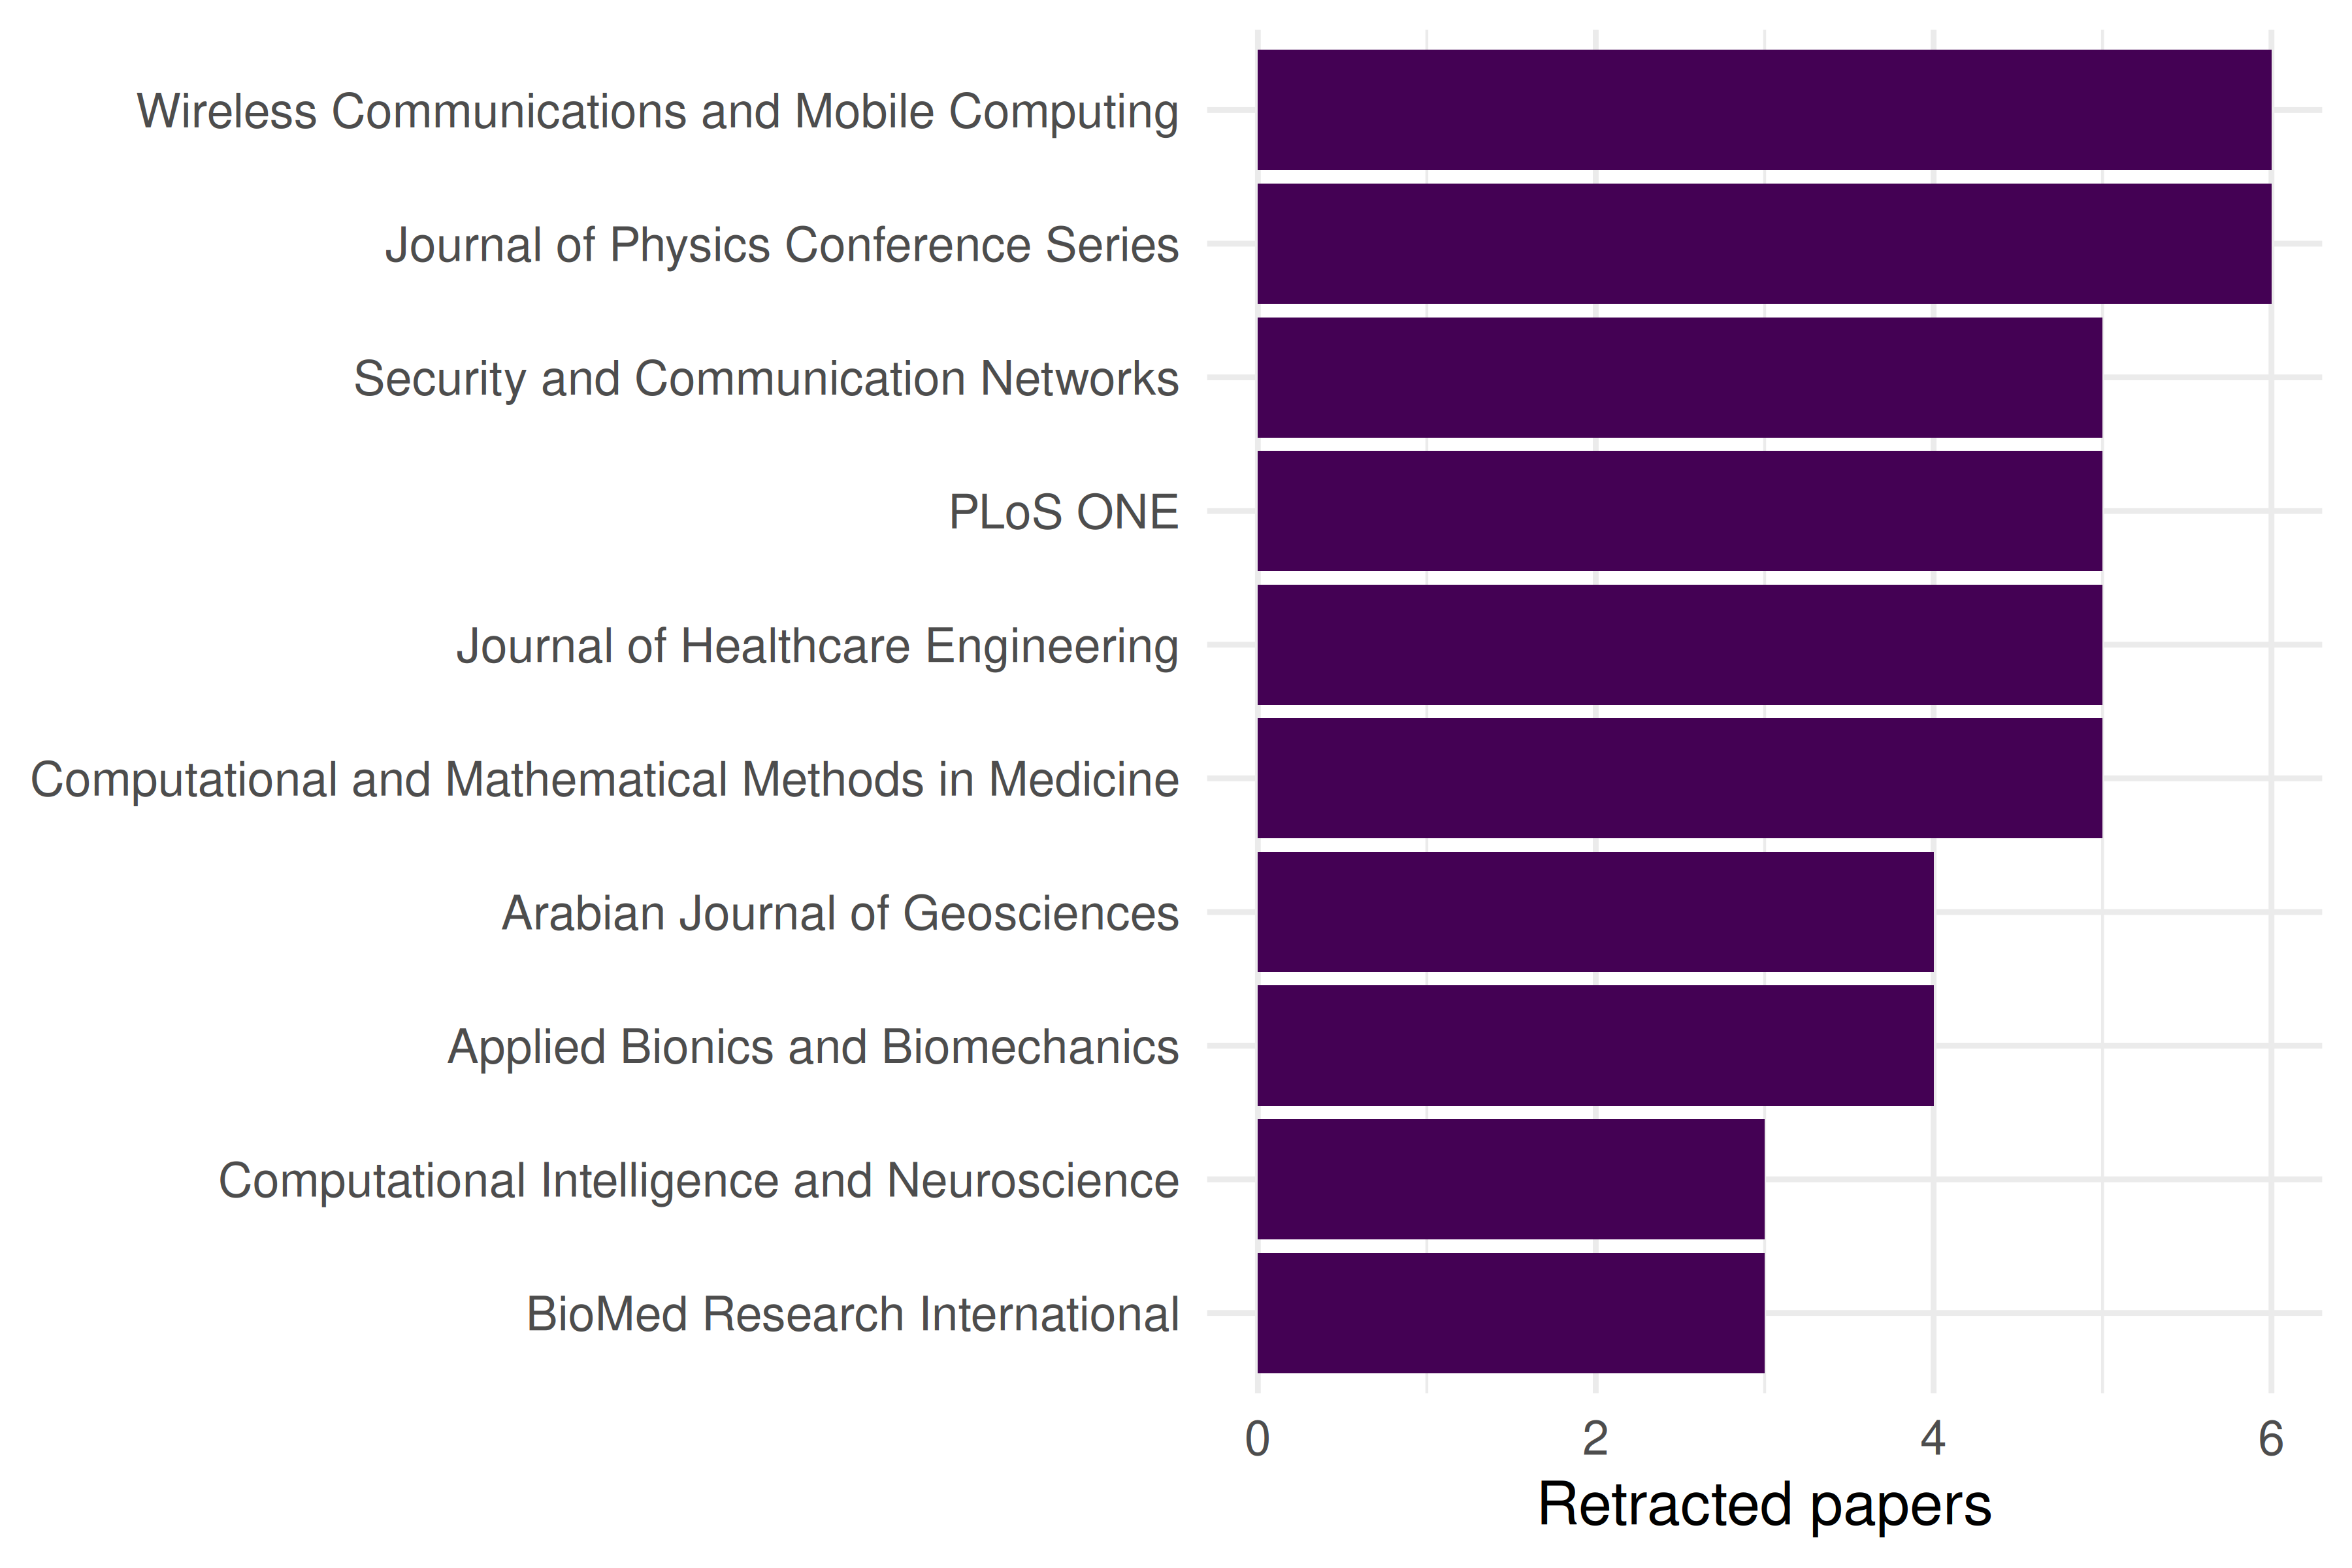
Figure 30.2: Top journals with the most retracted papers in the sample.
30.4.4 Citation persistence over time
retracted |>
  mutate(age = 2024 - year(publication_date)) |>
  filter(age >= 1, age <= 12) |>
  group_by(age) |>
  summarise(mean_cites = mean(cited_by_count), n = n(), .groups = "drop") |>
  ggplot(aes(x = age, y = mean_cites)) +
  geom_line(linewidth = 1, colour = palette_sci(1)) +
  geom_point(size = 2, colour = palette_sci(1)) +
  labs(x = "Years since publication", y = "Mean citations") +
  theme_sci()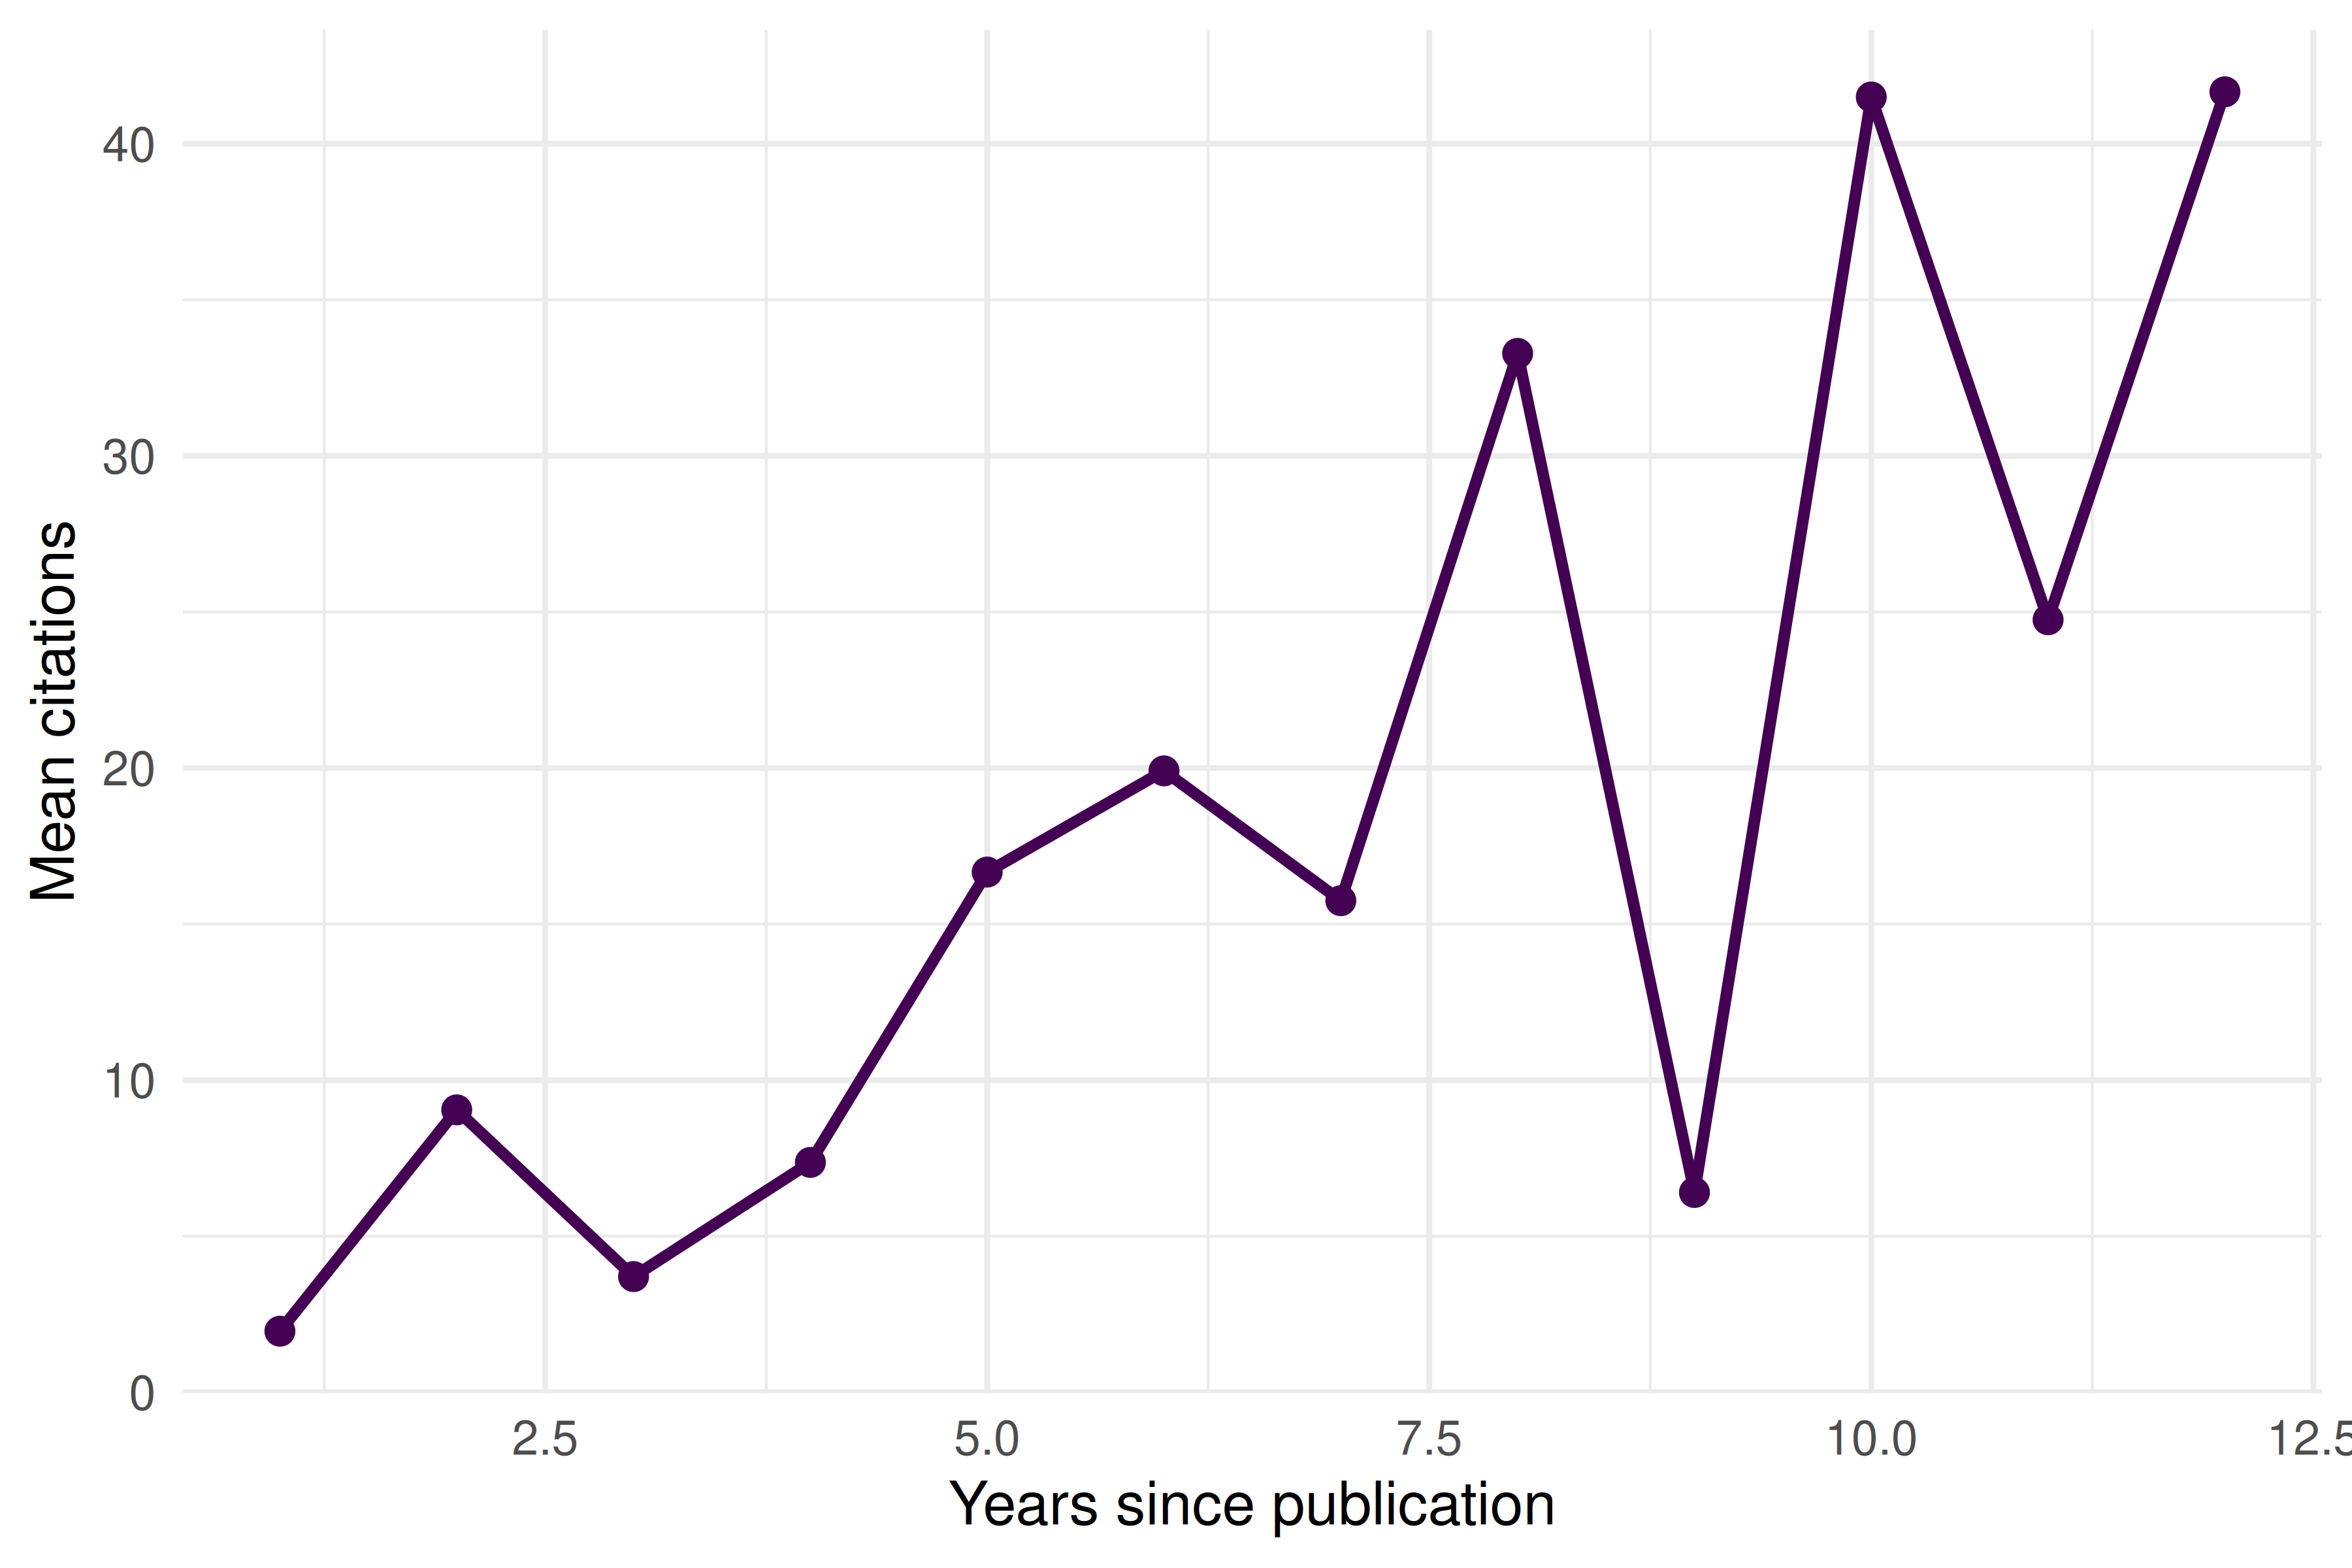
Figure 30.3: Mean citations by publication age for retracted papers.
30.5 Diagnostics and interpretation
- Coverage: OpenAlex retraction coverage depends on publisher metadata. Not all retractions are flagged. Cross-check with Retraction Watch for comprehensive coverage.
- Retraction vs. publication date: The publication date is when the paper was published, not when it was retracted. The gap between these dates varies from months to decades.
- Positive vs. negative citations: Citation counts do not distinguish between “this paper found X” (positive, problematic) and “this paper was retracted for Y” (negative, appropriate). Manual checking of citing contexts is needed.
- Denominator: Retraction rates require the total number of publications as denominator. Raw retraction counts favour large journals.
30.7 Limitations and responsible use
- Retractions are not all equal. Some retractions reflect honest error, others fraud. The reason for retraction matters for interpretation but is often not coded in bibliometric databases.
- Stigmatisation risk. Listing authors or institutions with high retraction counts can be stigmatising. Report aggregate patterns, not individual-level data, unless specifically studying misconduct.
- Database lag. Retraction notices may take months or years to propagate through databases. Recent retraction data is incomplete.
- Self-correction is broader than retraction. Corrections, expressions of concern, and errata also contribute to self-correction but are harder to track bibliometrically.
- Do not equate retractions with research quality. Fields with more scrutiny detect more problems. A high retraction rate may indicate effective oversight, not worse science (Hicks et al. 2015).
30.9 Common pitfalls
- Counting retractions without denominators. A journal with 10 retractions from 50,000 papers has a lower retraction rate than one with 5 from 1,000.
- Assuming all post-retraction citations are problematic. Some citing papers may specifically discuss the retraction or cite the paper for methodology that remains valid despite data issues.
- Ignoring retraction reasons. Honest errors should be distinguished from misconduct in any analysis of research integrity.
- Using retraction analysis for individual evaluation. Authors of retracted papers may be victims of co-author misconduct. Never use retraction counts as performance indicators.
30.10 Exercises
Retraction rate by field. Fetch retracted works from two different fields. Compare the retraction rate (retractions per 1,000 publications). Account for corpus size.
Citation trajectory. For a retracted paper with many citations, examine when the citations accumulated. Were most citations received before or after the retraction?
Retraction-citation correlation. Is there a relationship between a paper’s citation count at the time of retraction and the number of post-retraction citations it receives?
30.11 Solutions
Solutions are provided in 2.11.
30.13 Session info
#> R version 4.4.1 (2024-06-14)
#> Platform: x86_64-pc-linux-gnu
#> Running under: Ubuntu 24.04.4 LTS
#>
#> Matrix products: default
#> BLAS:   /usr/lib/x86_64-linux-gnu/openblas-pthread/libblas.so.3
#> LAPACK: /usr/lib/x86_64-linux-gnu/openblas-pthread/libopenblasp-r0.3.26.so;  LAPACK version 3.12.0
#>
#> locale:
#>  [1] LC_CTYPE=C.UTF-8       LC_NUMERIC=C           LC_TIME=C.UTF-8
#>  [4] LC_COLLATE=C.UTF-8     LC_MONETARY=C.UTF-8    LC_MESSAGES=C.UTF-8
#>  [7] LC_PAPER=C.UTF-8       LC_NAME=C              LC_ADDRESS=C
#> [10] LC_TELEPHONE=C         LC_MEASUREMENT=C.UTF-8 LC_IDENTIFICATION=C
#>
#> time zone: UTC
#> tzcode source: system (glibc)
#>
#> attached base packages:
#> [1] stats     graphics  grDevices utils     datasets  methods   base
#>
#> other attached packages:
#>  [1] uwot_0.2.4                Matrix_1.7-0
#>  [3] word2vec_0.4.1            stm_1.3.8
#>  [5] topicmodels_0.2-17        quanteda.textstats_0.97.2
#>  [7] visNetwork_2.1.4          ggraph_2.2.2
#>  [9] tidygraph_1.3.1           igraph_2.3.2
#> [11] quanteda_4.4              pdftools_3.9.0
#> [13] arrow_24.0.0              bibliometrix_5.4.0
#> [15] RefManageR_1.4.0          bib2df_1.1.2.0
#> [17] rcrossref_1.2.1           gt_1.3.0
#> [19] tidytext_0.4.3            glue_1.8.1
#> [21] openalexR_3.0.1           lubridate_1.9.5
#> [23] forcats_1.0.1             stringr_1.6.0
#> [25] dplyr_1.2.1               purrr_1.2.2
#> [27] readr_2.2.0               tidyr_1.3.2
#> [29] tibble_3.3.1              ggplot2_4.0.3
#> [31] tidyverse_2.0.0
#>
#> loaded via a namespace (and not attached):
#>   [1] bibtex_0.5.2           RColorBrewer_1.1-3     rstudioapi_0.18.0
#>   [4] jsonlite_2.0.0         magrittr_2.0.5         modeltools_0.2-24
#>   [7] farver_2.1.2           rmarkdown_2.31         fs_2.1.0
#>  [10] vctrs_0.7.3            memoise_2.0.1          askpass_1.2.1
#>  [13] base64enc_0.1-6        htmltools_0.5.9        contentanalysis_1.0.0
#>  [16] curl_7.1.0             janeaustenr_1.0.0      cellranger_1.1.0
#>  [19] sass_0.4.10            bslib_0.11.0           htmlwidgets_1.6.4
#>  [22] tokenizers_0.3.0       plyr_1.8.9             httr2_1.2.2
#>  [25] plotly_4.12.0          cachem_1.1.0           dimensionsR_0.0.3
#>  [28] mime_0.13              lifecycle_1.0.5        pkgconfig_2.0.3
#>  [31] R6_2.6.1               fastmap_1.2.0          shiny_1.13.0
#>  [34] digest_0.6.39          patchwork_1.3.2        shinycssloaders_1.1.0
#>  [37] rprojroot_2.1.1        RSpectra_0.16-2        SnowballC_0.7.1
#>  [40] labeling_0.4.3         urltools_1.7.3.1       timechange_0.4.0
#>  [43] mgcv_1.9-1             polyclip_1.10-7        httr_1.4.8
#>  [46] compiler_4.4.1         here_1.0.2             bit64_4.8.0
#>  [49] withr_3.0.2            S7_0.2.2               backports_1.5.1
#>  [52] viridis_0.6.5          ggforce_0.5.0          MASS_7.3-60.2
#>  [55] rappdirs_0.3.4         bibliometrixData_0.3.0 tools_4.4.1
#>  [58] otel_0.2.0             stopwords_2.3          zip_2.3.3
#>  [61] httpuv_1.6.17          rentrez_1.2.4          nlme_3.1-164
#>  [64] promises_1.5.0         grid_4.4.1             stringdist_0.9.17
#>  [67] reshape2_1.4.5         generics_0.1.4         gtable_0.3.6
#>  [70] tzdb_0.5.0             rscopus_0.9.0          ca_0.71.1
#>  [73] data.table_1.18.4      hms_1.1.4              xml2_1.5.2
#>  [76] utf8_1.2.6             ggrepel_0.9.8          pillar_1.11.1
#>  [79] nsyllable_1.0.1        vroom_1.7.1            later_1.4.8
#>  [82] splines_4.4.1          tweenr_2.0.3           brand.yml_0.1.0
#>  [85] lattice_0.22-6         FNN_1.1.4.1            bit_4.6.0
#>  [88] tidyselect_1.2.1       tm_0.7-18              miniUI_0.1.2
#>  [91] downlit_0.4.5          knitr_1.51             gridExtra_2.3
#>  [94] NLP_0.3-2              bookdown_0.46          stats4_4.4.1
#>  [97] crul_1.6.0             xfun_0.57              graphlayouts_1.2.3
#> [100] matrixStats_1.5.0      DT_0.34.0              humaniformat_0.6.0
#> [103] stringi_1.8.7          lazyeval_0.2.3         qpdf_1.4.1
#> [106] yaml_2.3.12            evaluate_1.0.5         codetools_0.2-20
#> [109] httpcode_0.3.0         cli_3.6.6              xtable_1.8-8
#> [112] jquerylib_0.1.4        dichromat_2.0-0.1      Rcpp_1.1.1-1.1
#> [115] readxl_1.4.5           triebeard_0.4.1        XML_3.99-0.23
#> [118] parallel_4.4.1         assertthat_0.2.1       pubmedR_1.0.2
#> [121] slam_0.1-55            viridisLite_0.4.3      scales_1.4.0
#> [124] crayon_1.5.3           openxlsx_4.2.8.1       rlang_1.2.0
#> [127] fastmatch_1.1-8