15 Temporal Analysis and Citation Aging
15.1 Learning objectives
After completing this chapter, you will be able to:
- Define and apply citation windows of different lengths
- Compute and interpret the citation half-life for a journal or corpus
- Plot citation aging curves showing how citations accumulate over time
- Calculate the Price index (proportion of references less than five years old)
- Analyse temporal trends in publication output and citation rates
- Explain how aging patterns differ across disciplines
15.3 Conceptual background
Citations are not evenly distributed over time. Most papers receive the bulk of their citations within a few years of publication, then gradually fade. This phenomenon — citation aging or obsolescence — was first studied systematically by Solla Price (1963), who observed that scientific literature has a characteristic “half-life”: the time by which half of all citations to a given year’s output have been received.
The citation half-life varies dramatically across disciplines. In fast-moving fields like molecular biology, half-lives may be three to four years; in mathematics or humanities, they can exceed ten years. This has direct consequences for metrics: a two-year Journal Impact Factor systematically undervalues journals in slow-aging fields (Waltman 2016).
A citation window is the fixed period after publication during which citations are counted. The JIF uses a two-year window; CiteScore uses four years. Choosing the window involves a trade-off: short windows favour fast-aging fields but miss delayed-recognition papers; long windows are more inclusive but dilute the signal of recent trends.
The Price index — the proportion of references in a paper’s bibliography that are less than five years old — measures how rapidly a field consumes recent literature. A high Price index indicates a fast-moving frontier field; a low Price index suggests reliance on older foundational works. Solla Price (1963) introduced this as an “immediacy” measure.
Sleeping beauties — papers that receive few citations for years then suddenly attract attention (Kleinberg 2003) — violate the standard aging model. Their existence is a reminder that citation half-lives describe averages, not individual papers. Garfield (1955) already noted that some ideas take decades to be recognised.
Understanding citation temporality is essential for fair evaluation. Comparing citation counts without accounting for publication year, citation window, and field-specific aging rates produces meaningless results.
15.4 Worked example
15.4.1 Acquiring the data
We fetch works from two journals with different expected aging profiles.
# Scientometrics (social science, moderate aging)
works_sciento <- oa_fetch(
  entity = "works",
  primary_location.source.id = "S148561398",
  from_publication_date = "2013-01-01",
  to_publication_date = "2018-12-31",
  type = "article",
  options = list(sample = 400, seed = 42)
)

# PLOS ONE (multidisciplinary, faster aging)
works_plos <- oa_fetch(
  entity = "works",
  primary_location.source.id = "S202381698",
  from_publication_date = "2013-01-01",
  to_publication_date = "2018-12-31",
  type = "article",
  options = list(sample = 400, seed = 42)
)

works_all <- bind_rows(
  works_sciento |> mutate(journal = "Scientometrics"),
  works_plos |> mutate(journal = "PLOS ONE")
) |>
  mutate(year = year(publication_date),
         age = 2024 - year)
15.4.2 Citation aging curves
We compute mean citations by age (years since publication) for each journal.
aging <- works_all |>
  group_by(journal, age) |>
  summarise(
    mean_cites = mean(cited_by_count, na.rm = TRUE),
    median_cites = median(cited_by_count, na.rm = TRUE),
    n = n(),
    .groups = "drop"
  ) |>
  arrange(journal, age)
ggplot(aging, aes(x = age, y = mean_cites, colour = journal)) +
  geom_line(linewidth = 1) +
  geom_point(size = 2) +
  scale_colour_manual(values = palette_sci(2)) +
  labs(x = "Years since publication", y = "Mean citations",
       colour = "Journal") +
  theme_sci()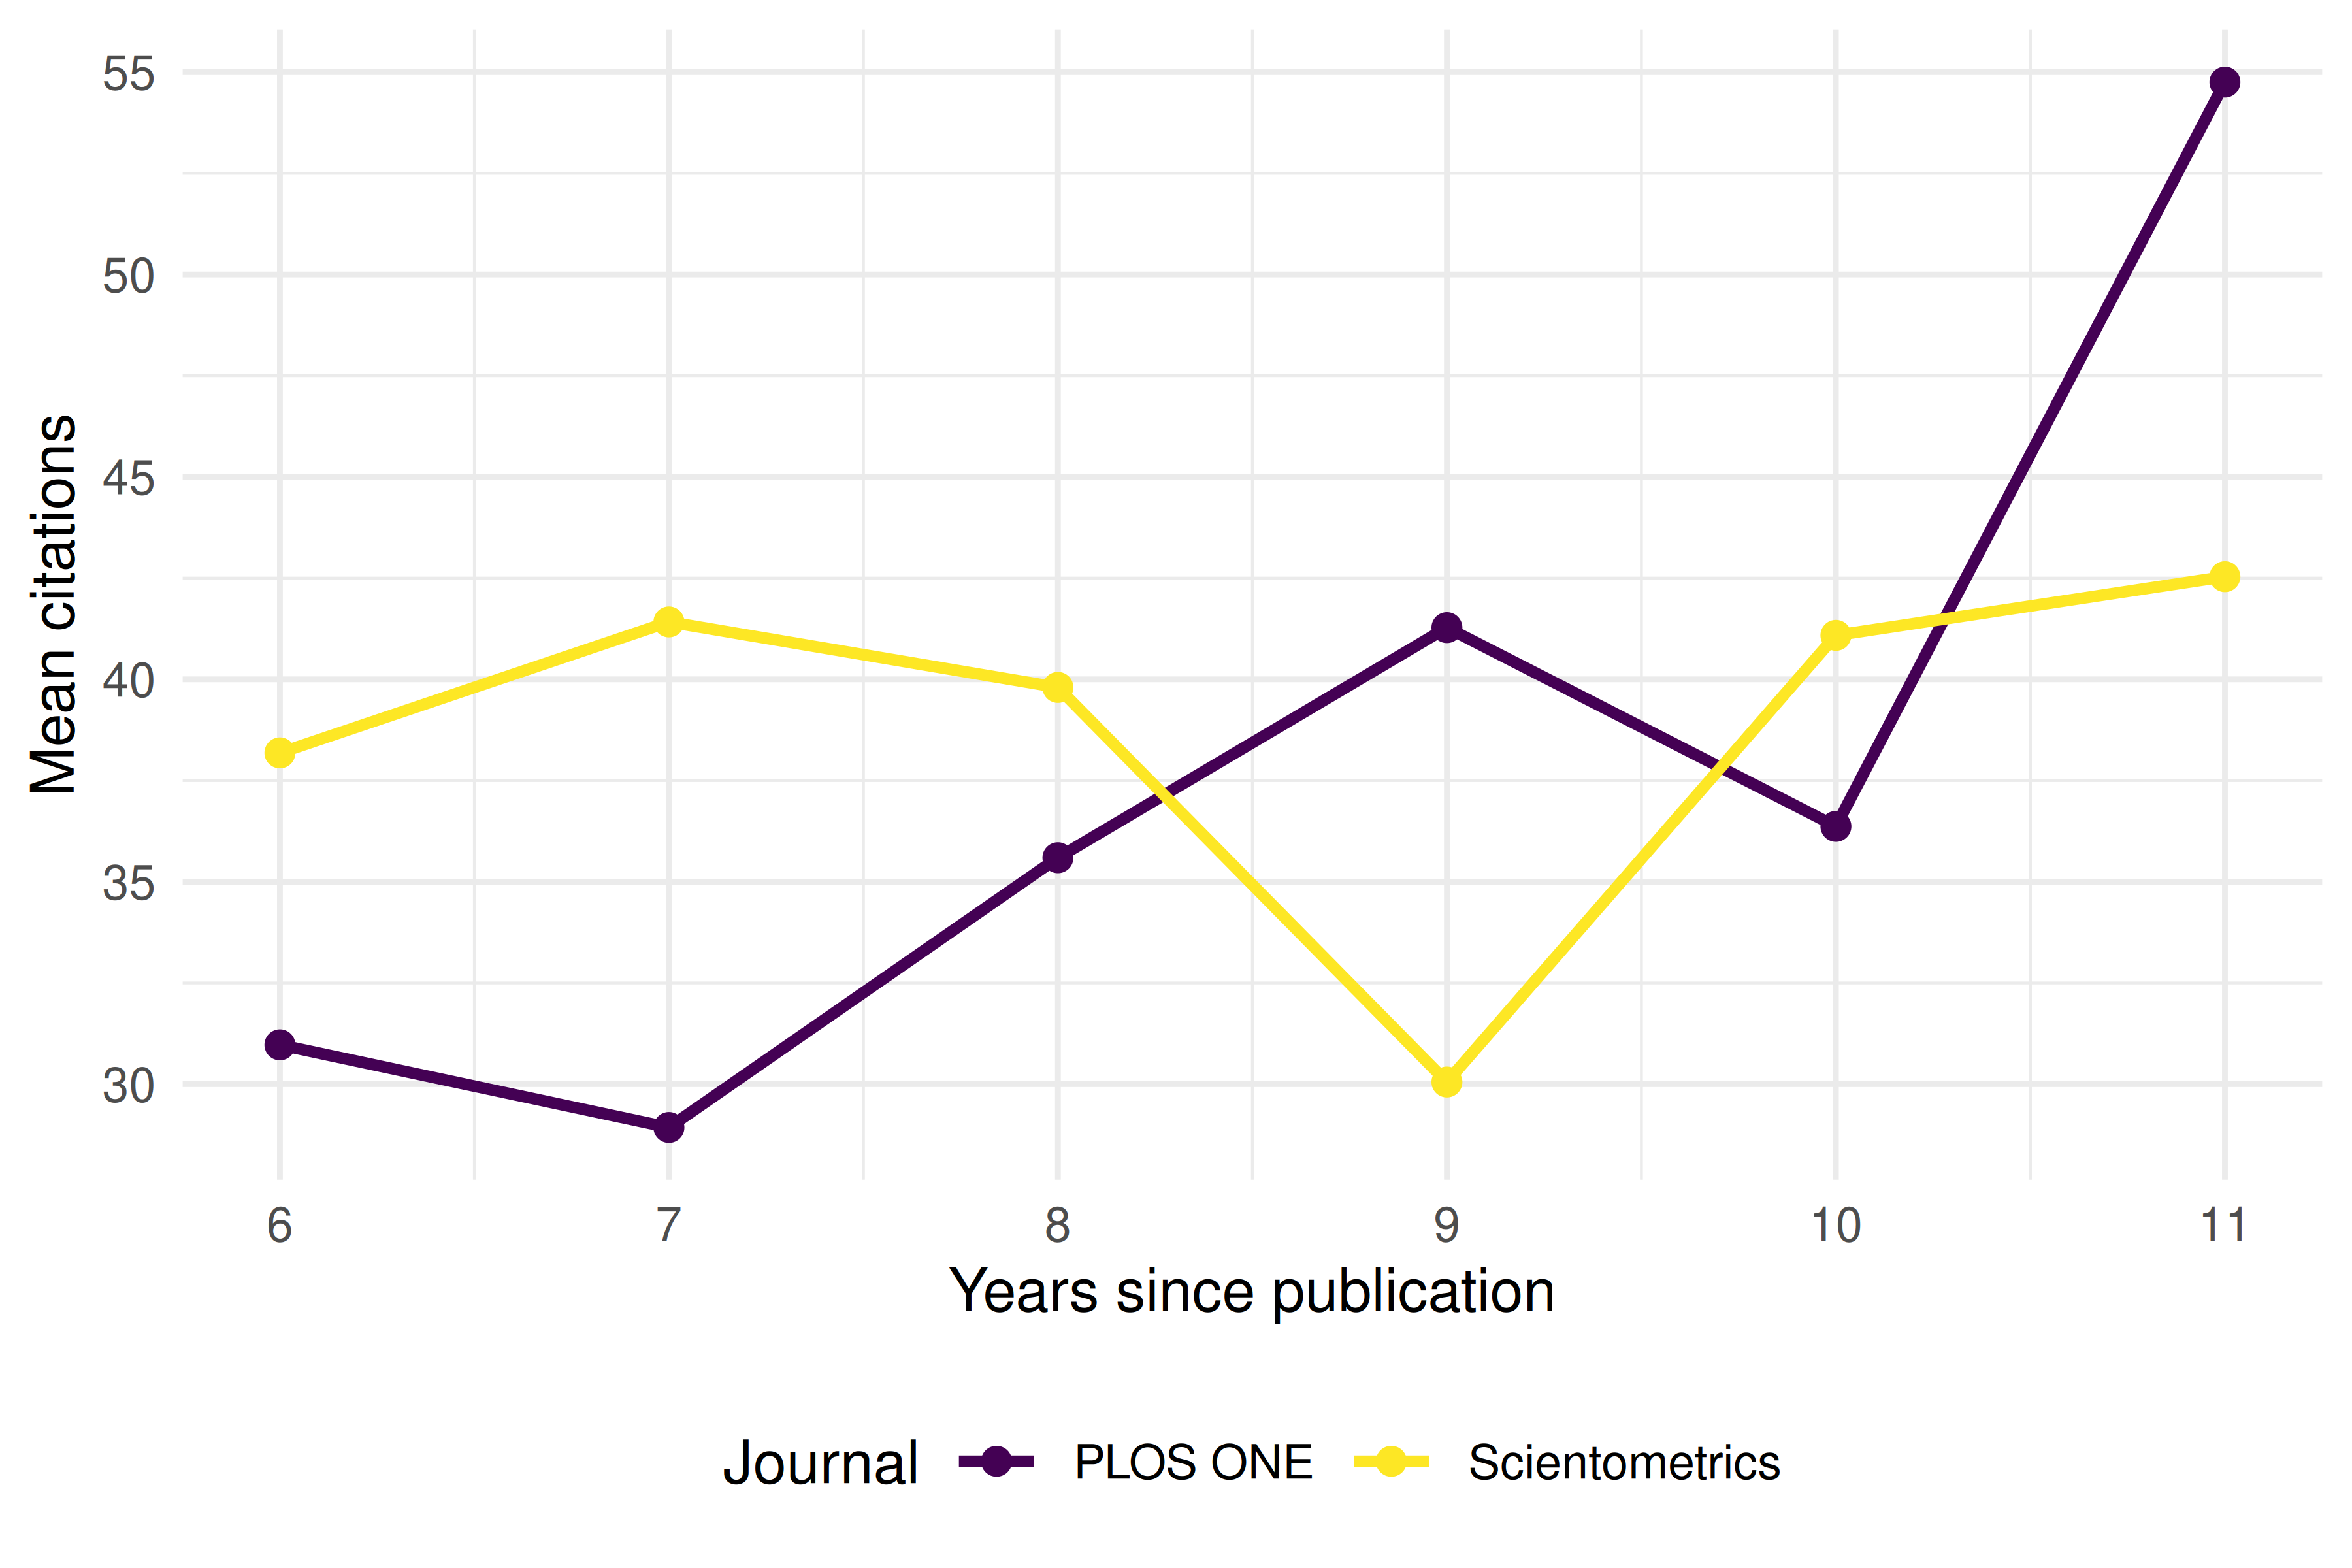
Figure 15.1: Citation aging curves for Scientometrics and PLOS ONE articles published 2013-2018.
15.4.3 Estimating citation half-life
We estimate the half-life as the age at which cumulative citations reach 50% of total.
half_life <- works_all |>
  group_by(journal) |>
  arrange(age) |>
  mutate(
    cum_cites = cumsum(cited_by_count),
    total_cites = sum(cited_by_count),
    cum_pct = cum_cites / total_cites
  ) |>
  summarise(
    total_cites = first(total_cites),
    half_life_age = min(age[cum_pct >= 0.50]),
    .groups = "drop"
  )

half_life |>
  gt() |>
  cols_label(
    journal = "Journal",
    total_cites = "Total citations",
    half_life_age = "Half-life (years)"
)| Journal | Total citations | Half-life (years) |
|---|---|---|
| PLOS ONE | 15748 | 10 |
| Scientometrics | 16979 | 8 |
15.4.4 Price index
The Price index is the fraction of references less than five years old. A full computation requires publication years of each reference; here we show reference-list lengths as a starting point.
works_all |>
  filter(!is.na(referenced_works_count), referenced_works_count > 0) |>
  group_by(journal) |>
  summarise(mean_refs = round(mean(referenced_works_count), 1), .groups = "drop")
#> # A tibble: 2 × 2
#> journal mean_refs
#> <chr> <dbl>
#> 1 PLOS ONE 50.5
#> 2 Scientometrics 42.515.4.5 Cumulative citation trajectories
cum_aging <- works_all |>
  group_by(journal, age) |>
  summarise(total = sum(cited_by_count), .groups = "drop") |>
  group_by(journal) |>
  arrange(age) |>
  mutate(
    cum_total = cumsum(total),
    cum_pct = cum_total / sum(total)
  )

ggplot(cum_aging, aes(x = age, y = cum_pct, colour = journal)) +
  geom_line(linewidth = 1) +
  geom_hline(yintercept = 0.5, linetype = "dashed", colour = "grey50") +
  scale_y_continuous(labels = scales::percent) +
  scale_colour_manual(values = palette_sci(2)) +
  labs(x = "Years since publication", y = "Cumulative % of citations",
       colour = "Journal") +
  annotate("text", x = 9, y = 0.52, label = "50% threshold",
           colour = "grey40", size = 3.5) +
  theme_sci()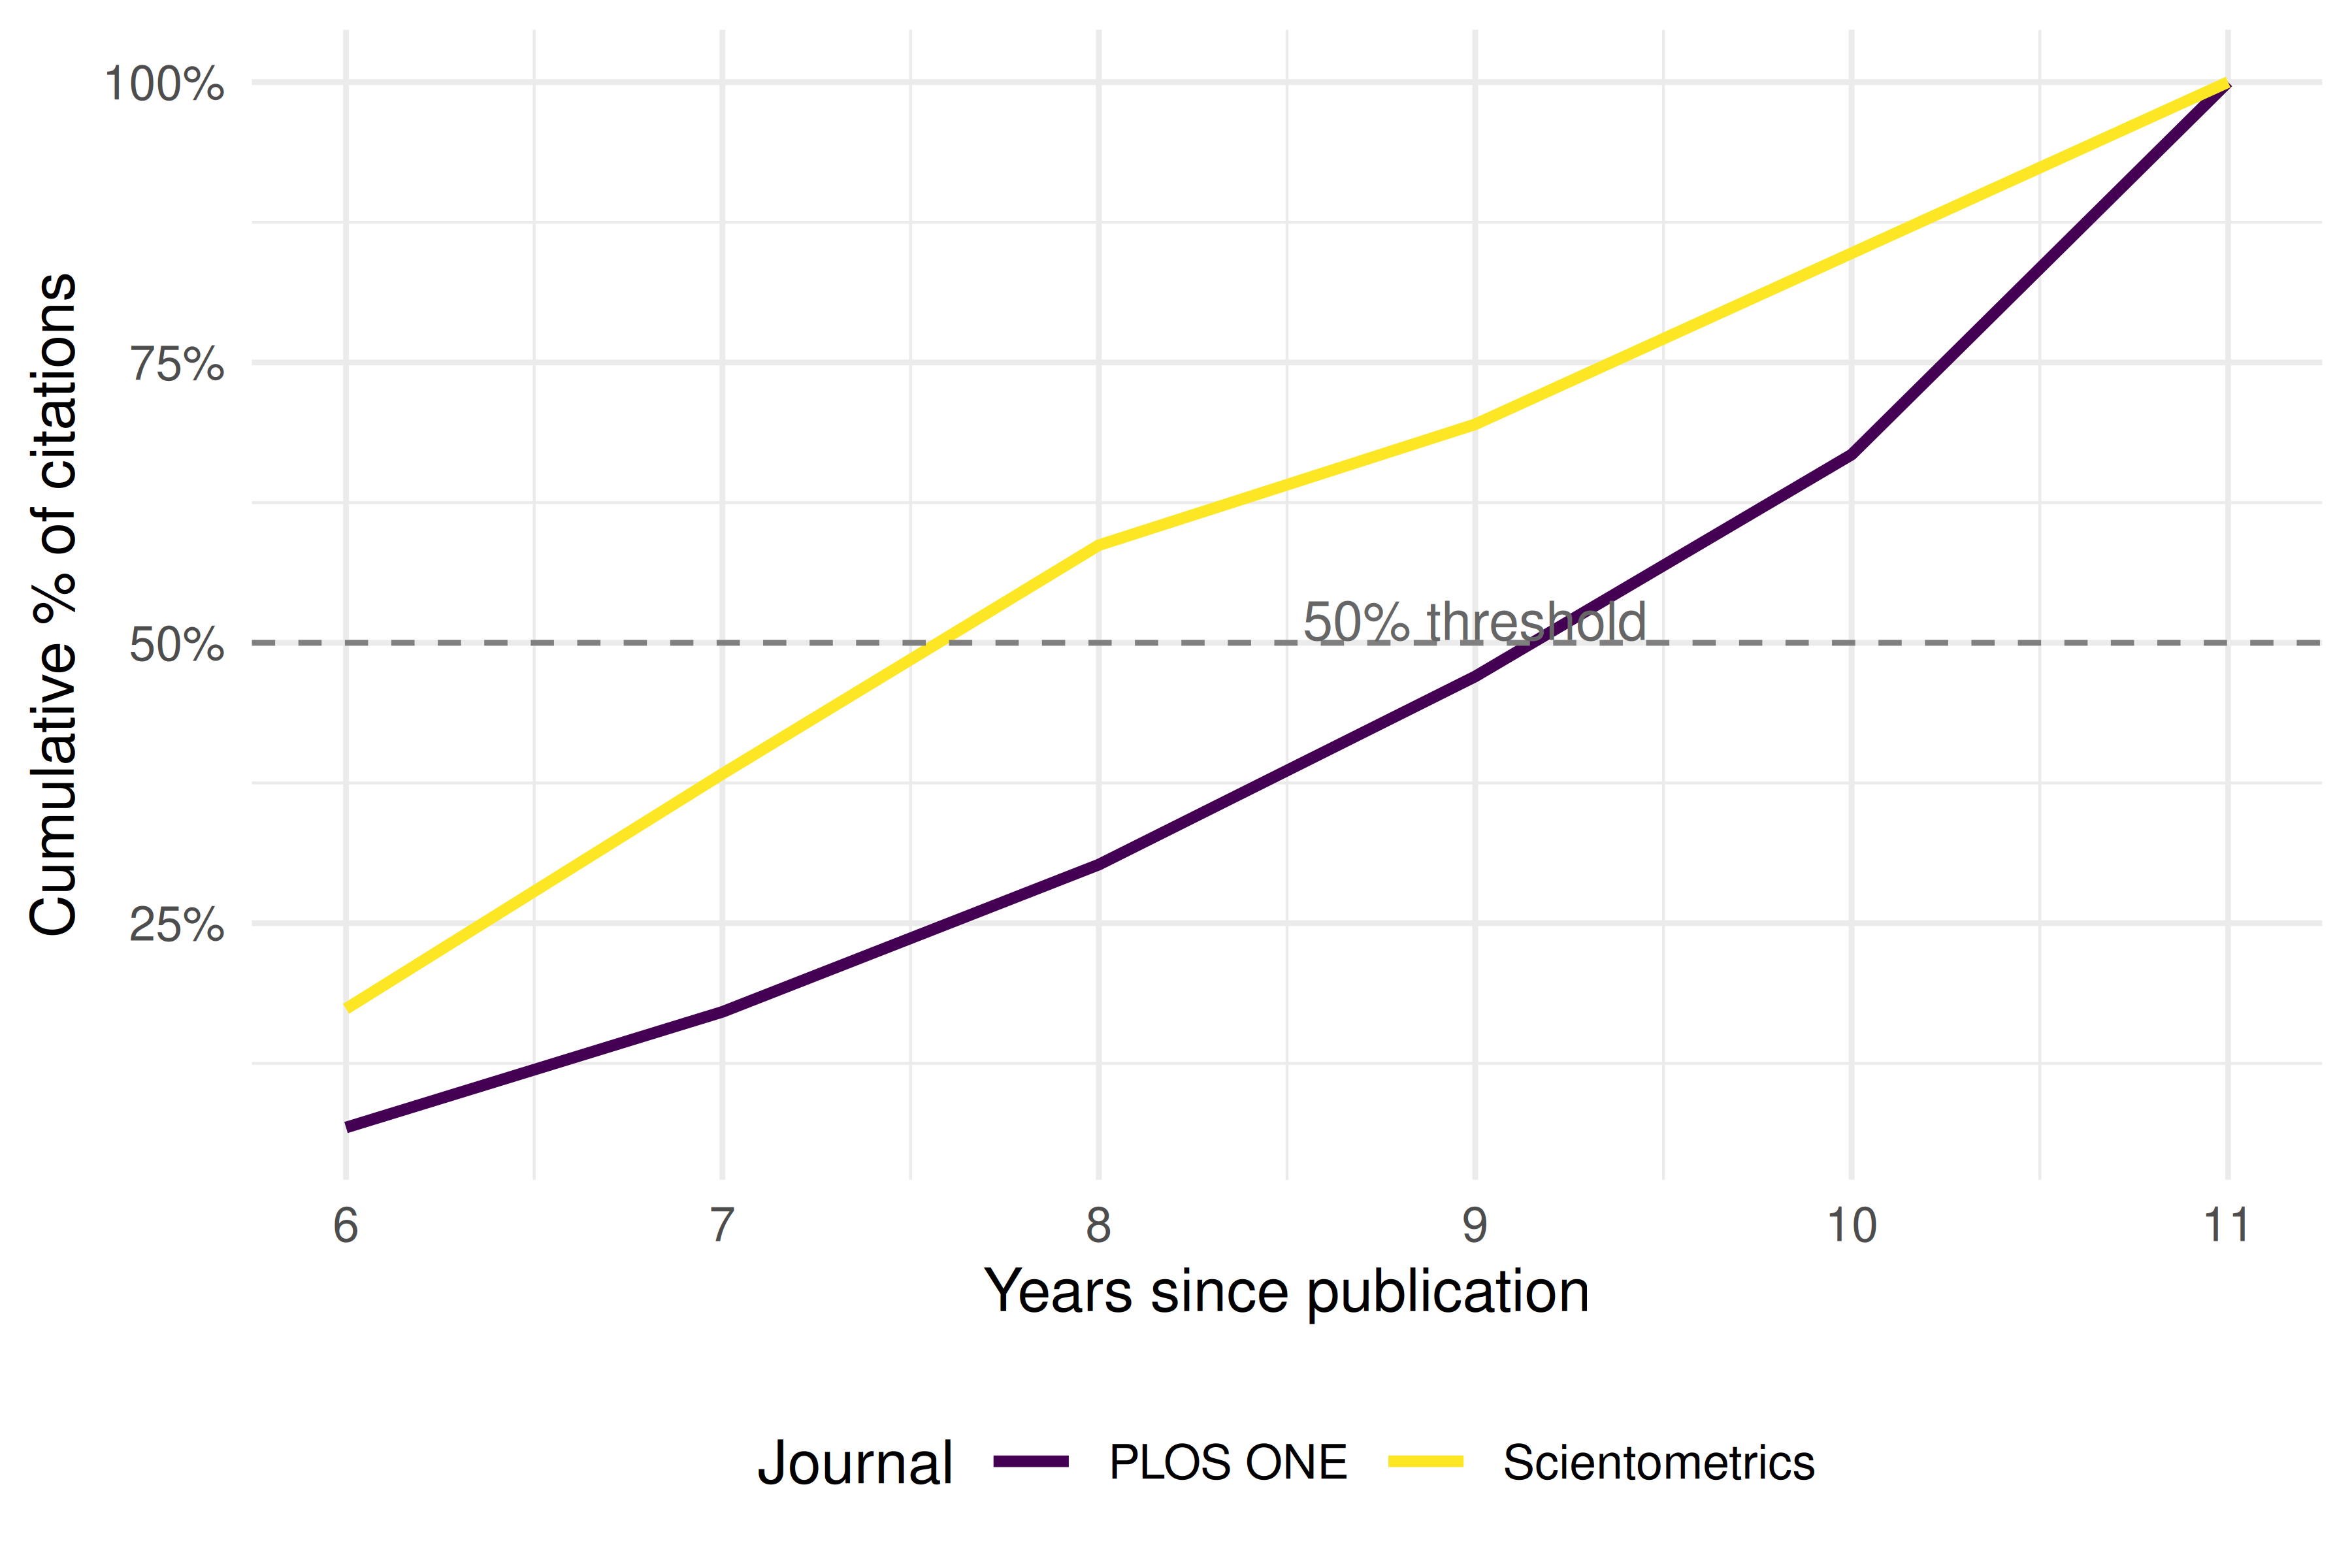
Figure 15.2: Cumulative citation percentage by years since publication.
15.5 Diagnostics and interpretation
- Sample size per age bin: Ensure each year has enough papers for stable estimates. Small cohorts produce noisy aging curves.
- Truncation: Papers published in the most recent year have not had time to accumulate citations. Exclude or flag incomplete citation windows.
- Disciplinary benchmarks: Compare your half-life estimates against known benchmarks. Social sciences typically have half-lives of 5-8 years; biomedical fields 3-5 years; mathematics 8-12 years.
- Outliers: A few extremely highly cited papers can distort mean-based aging curves. Compare mean and median trajectories.
15.7 Limitations and responsible use
- Half-life is an average. Individual papers deviate wildly from the average aging pattern. Sleeping beauties and flash-in-the-pan papers both exist.
- Database lag. Citation counts in OpenAlex may lag behind reality by weeks or months. Very recent citation data is unreliable.
- Survivor bias. Retracted papers or papers removed from databases disappear from aging analyses, potentially biasing half-life estimates.
- Citation inflation. The total volume of citations has grown over time. A paper published in 2020 will accumulate citations faster than an identical paper published in 2000, simply because there are more papers being published (Solla Price 1963).
- Do not penalise slow-aging fields. Using short citation windows systematically undervalues mathematics, humanities, and theoretical disciplines (Hicks et al. 2015).
15.9 Common pitfalls
- Mixing citation windows. Comparing a 2-year JIF for one journal with lifetime citations for another produces meaningless rankings.
- Ignoring publication-year effects. A corpus spanning 2000-2023 includes papers with 23 years of citation history alongside papers with 1 year. Normalise by publication year.
- Confusing obsolescence with irrelevance. A declining citation curve does not mean the knowledge is wrong or useless; it may mean the ideas have been absorbed into textbooks or standard practice.
- Forgetting about the denominator. If the number of publications in a field is growing, the absolute citation count grows even if the per-paper impact is constant.
15.10 Exercises
Half-life comparison. Fetch works from a mathematics journal and a biomedical journal. Compute and compare their citation half-lives. Does the difference match disciplinary expectations?
Price index computation. For a set of papers with known reference lists, compute the actual Price index (fraction of references < 5 years old). (Hint: you will need to fetch metadata for the referenced works.)
Sleeping beauty detection. Identify papers that received fewer than 2 citations in their first 3 years but more than 20 total. What are these papers about?
Median vs. mean aging. Replot the aging curves using median instead of mean citations. How does the shape change, and why?
Citation window sensitivity. For a single journal, compute a JIF-like proxy using 2-year, 3-year, and 5-year windows. How much does the value change?
15.11 Solutions
Solutions are provided in 2.11.
15.12 Further reading
- Solla Price (1963) — Little Science, Big Science; introduced citation aging and the Price index.
- Garfield (1955) — The origin of citation indexing, including early observations on citation temporality.
- Kleinberg (2003) — Bursty patterns in temporal data; relevant to sleeping beauties and sudden citation surges.
- Waltman (2016) — Review of citation indicators, including discussion of citation windows and aging.
- Hicks et al. (2015) — The Leiden Manifesto; warns against penalising slow-aging fields with short citation windows.
15.13 Session info
#> R version 4.4.1 (2024-06-14)
#> Platform: x86_64-pc-linux-gnu
#> Running under: Ubuntu 24.04.4 LTS
#>
#> Matrix products: default
#> BLAS:   /usr/lib/x86_64-linux-gnu/openblas-pthread/libblas.so.3
#> LAPACK: /usr/lib/x86_64-linux-gnu/openblas-pthread/libopenblasp-r0.3.26.so;  LAPACK version 3.12.0
#>
#> locale:
#>  [1] LC_CTYPE=C.UTF-8       LC_NUMERIC=C           LC_TIME=C.UTF-8
#>  [4] LC_COLLATE=C.UTF-8     LC_MONETARY=C.UTF-8    LC_MESSAGES=C.UTF-8
#>  [7] LC_PAPER=C.UTF-8       LC_NAME=C              LC_ADDRESS=C
#> [10] LC_TELEPHONE=C         LC_MEASUREMENT=C.UTF-8 LC_IDENTIFICATION=C
#>
#> time zone: UTC
#> tzcode source: system (glibc)
#>
#> attached base packages:
#> [1] stats     graphics  grDevices utils     datasets  methods   base
#>
#> other attached packages:
#>  [1] quanteda_4.4       pdftools_3.9.0     arrow_24.0.0       bibliometrix_5.4.0
#>  [5] RefManageR_1.4.0   bib2df_1.1.2.0     rcrossref_1.2.1    gt_1.3.0
#>  [9] tidytext_0.4.3     glue_1.8.1         openalexR_3.0.1    lubridate_1.9.5
#> [13] forcats_1.0.1      stringr_1.6.0      dplyr_1.2.1        purrr_1.2.2
#> [17] readr_2.2.0        tidyr_1.3.2        tibble_3.3.1       ggplot2_4.0.3
#> [21] tidyverse_2.0.0
#>
#> loaded via a namespace (and not attached):
#>   [1] bibtex_0.5.2           RColorBrewer_1.1-3     rstudioapi_0.18.0
#>   [4] jsonlite_2.0.0         magrittr_2.0.5         farver_2.1.2
#>   [7] rmarkdown_2.31         fs_2.1.0               vctrs_0.7.3
#>  [10] memoise_2.0.1          askpass_1.2.1          base64enc_0.1-6
#>  [13] htmltools_0.5.9        contentanalysis_1.0.0  curl_7.1.0
#>  [16] janeaustenr_1.0.0      cellranger_1.1.0       sass_0.4.10
#>  [19] bslib_0.11.0           htmlwidgets_1.6.4      tokenizers_0.3.0
#>  [22] plyr_1.8.9             httr2_1.2.2            plotly_4.12.0
#>  [25] cachem_1.1.0           dimensionsR_0.0.3      igraph_2.3.2
#>  [28] mime_0.13              lifecycle_1.0.5        pkgconfig_2.0.3
#>  [31] Matrix_1.7-0           R6_2.6.1               fastmap_1.2.0
#>  [34] shiny_1.13.0           digest_0.6.39          shinycssloaders_1.1.0
#>  [37] rprojroot_2.1.1        SnowballC_0.7.1        labeling_0.4.3
#>  [40] urltools_1.7.3.1       timechange_0.4.0       httr_1.4.8
#>  [43] compiler_4.4.1         here_1.0.2             bit64_4.8.0
#>  [46] withr_3.0.2            S7_0.2.2               backports_1.5.1
#>  [49] viridis_0.6.5          rappdirs_0.3.4         bibliometrixData_0.3.0
#>  [52] tools_4.4.1            otel_0.2.0             stopwords_2.3
#>  [55] zip_2.3.3              httpuv_1.6.17          rentrez_1.2.4
#>  [58] promises_1.5.0         grid_4.4.1             stringdist_0.9.17
#>  [61] generics_0.1.4         gtable_0.3.6           tzdb_0.5.0
#>  [64] rscopus_0.9.0          ca_0.71.1              data.table_1.18.4
#>  [67] hms_1.1.4              xml2_1.5.2             utf8_1.2.6
#>  [70] ggrepel_0.9.8          pillar_1.11.1          later_1.4.8
#>  [73] brand.yml_0.1.0        lattice_0.22-6         bit_4.6.0
#>  [76] tidyselect_1.2.1       miniUI_0.1.2           downlit_0.4.5
#>  [79] knitr_1.51             gridExtra_2.3          bookdown_0.46
#>  [82] crul_1.6.0             xfun_0.57              DT_0.34.0
#>  [85] humaniformat_0.6.0     visNetwork_2.1.4       stringi_1.8.7
#>  [88] lazyeval_0.2.3         qpdf_1.4.1             yaml_2.3.12
#>  [91] evaluate_1.0.5         codetools_0.2-20       httpcode_0.3.0
#>  [94] cli_3.6.6              xtable_1.8-8           jquerylib_0.1.4
#>  [97] dichromat_2.0-0.1      Rcpp_1.1.1-1.1         readxl_1.4.5
#> [100] triebeard_0.4.1        XML_3.99-0.23          parallel_4.4.1
#> [103] assertthat_0.2.1       pubmedR_1.0.2          viridisLite_0.4.3
#> [106] scales_1.4.0           openxlsx_4.2.8.1       rlang_1.2.0
#> [109] fastmatch_1.1-8