39 Case Study 1: CRISPR Field Review (2010–2024)
39.1 Objective
Map the structure, growth, and evolution of CRISPR gene editing research from its emergence to its current state using open bibliometric data.
39.3 Data acquisition
works <- oa_fetch(
  entity = "works",
  search = "CRISPR",
  from_publication_date = "2010-01-01",
  to_publication_date = "2024-06-30",
  type = "article",
  options = list(sample = 500, seed = 42)
)

works <- works |>
  mutate(year = year(publication_date))

cat(glue("CRISPR articles retrieved: {nrow(works)}\n"))
#> CRISPR articles retrieved: 500#> Year range: 2010--202439.4 Publication growth
works |>
  count(year) |>
  ggplot(aes(x = year, y = n)) +
  geom_col(fill = palette_sci(1)) +
  labs(x = "Year", y = "Publications") +
  theme_sci()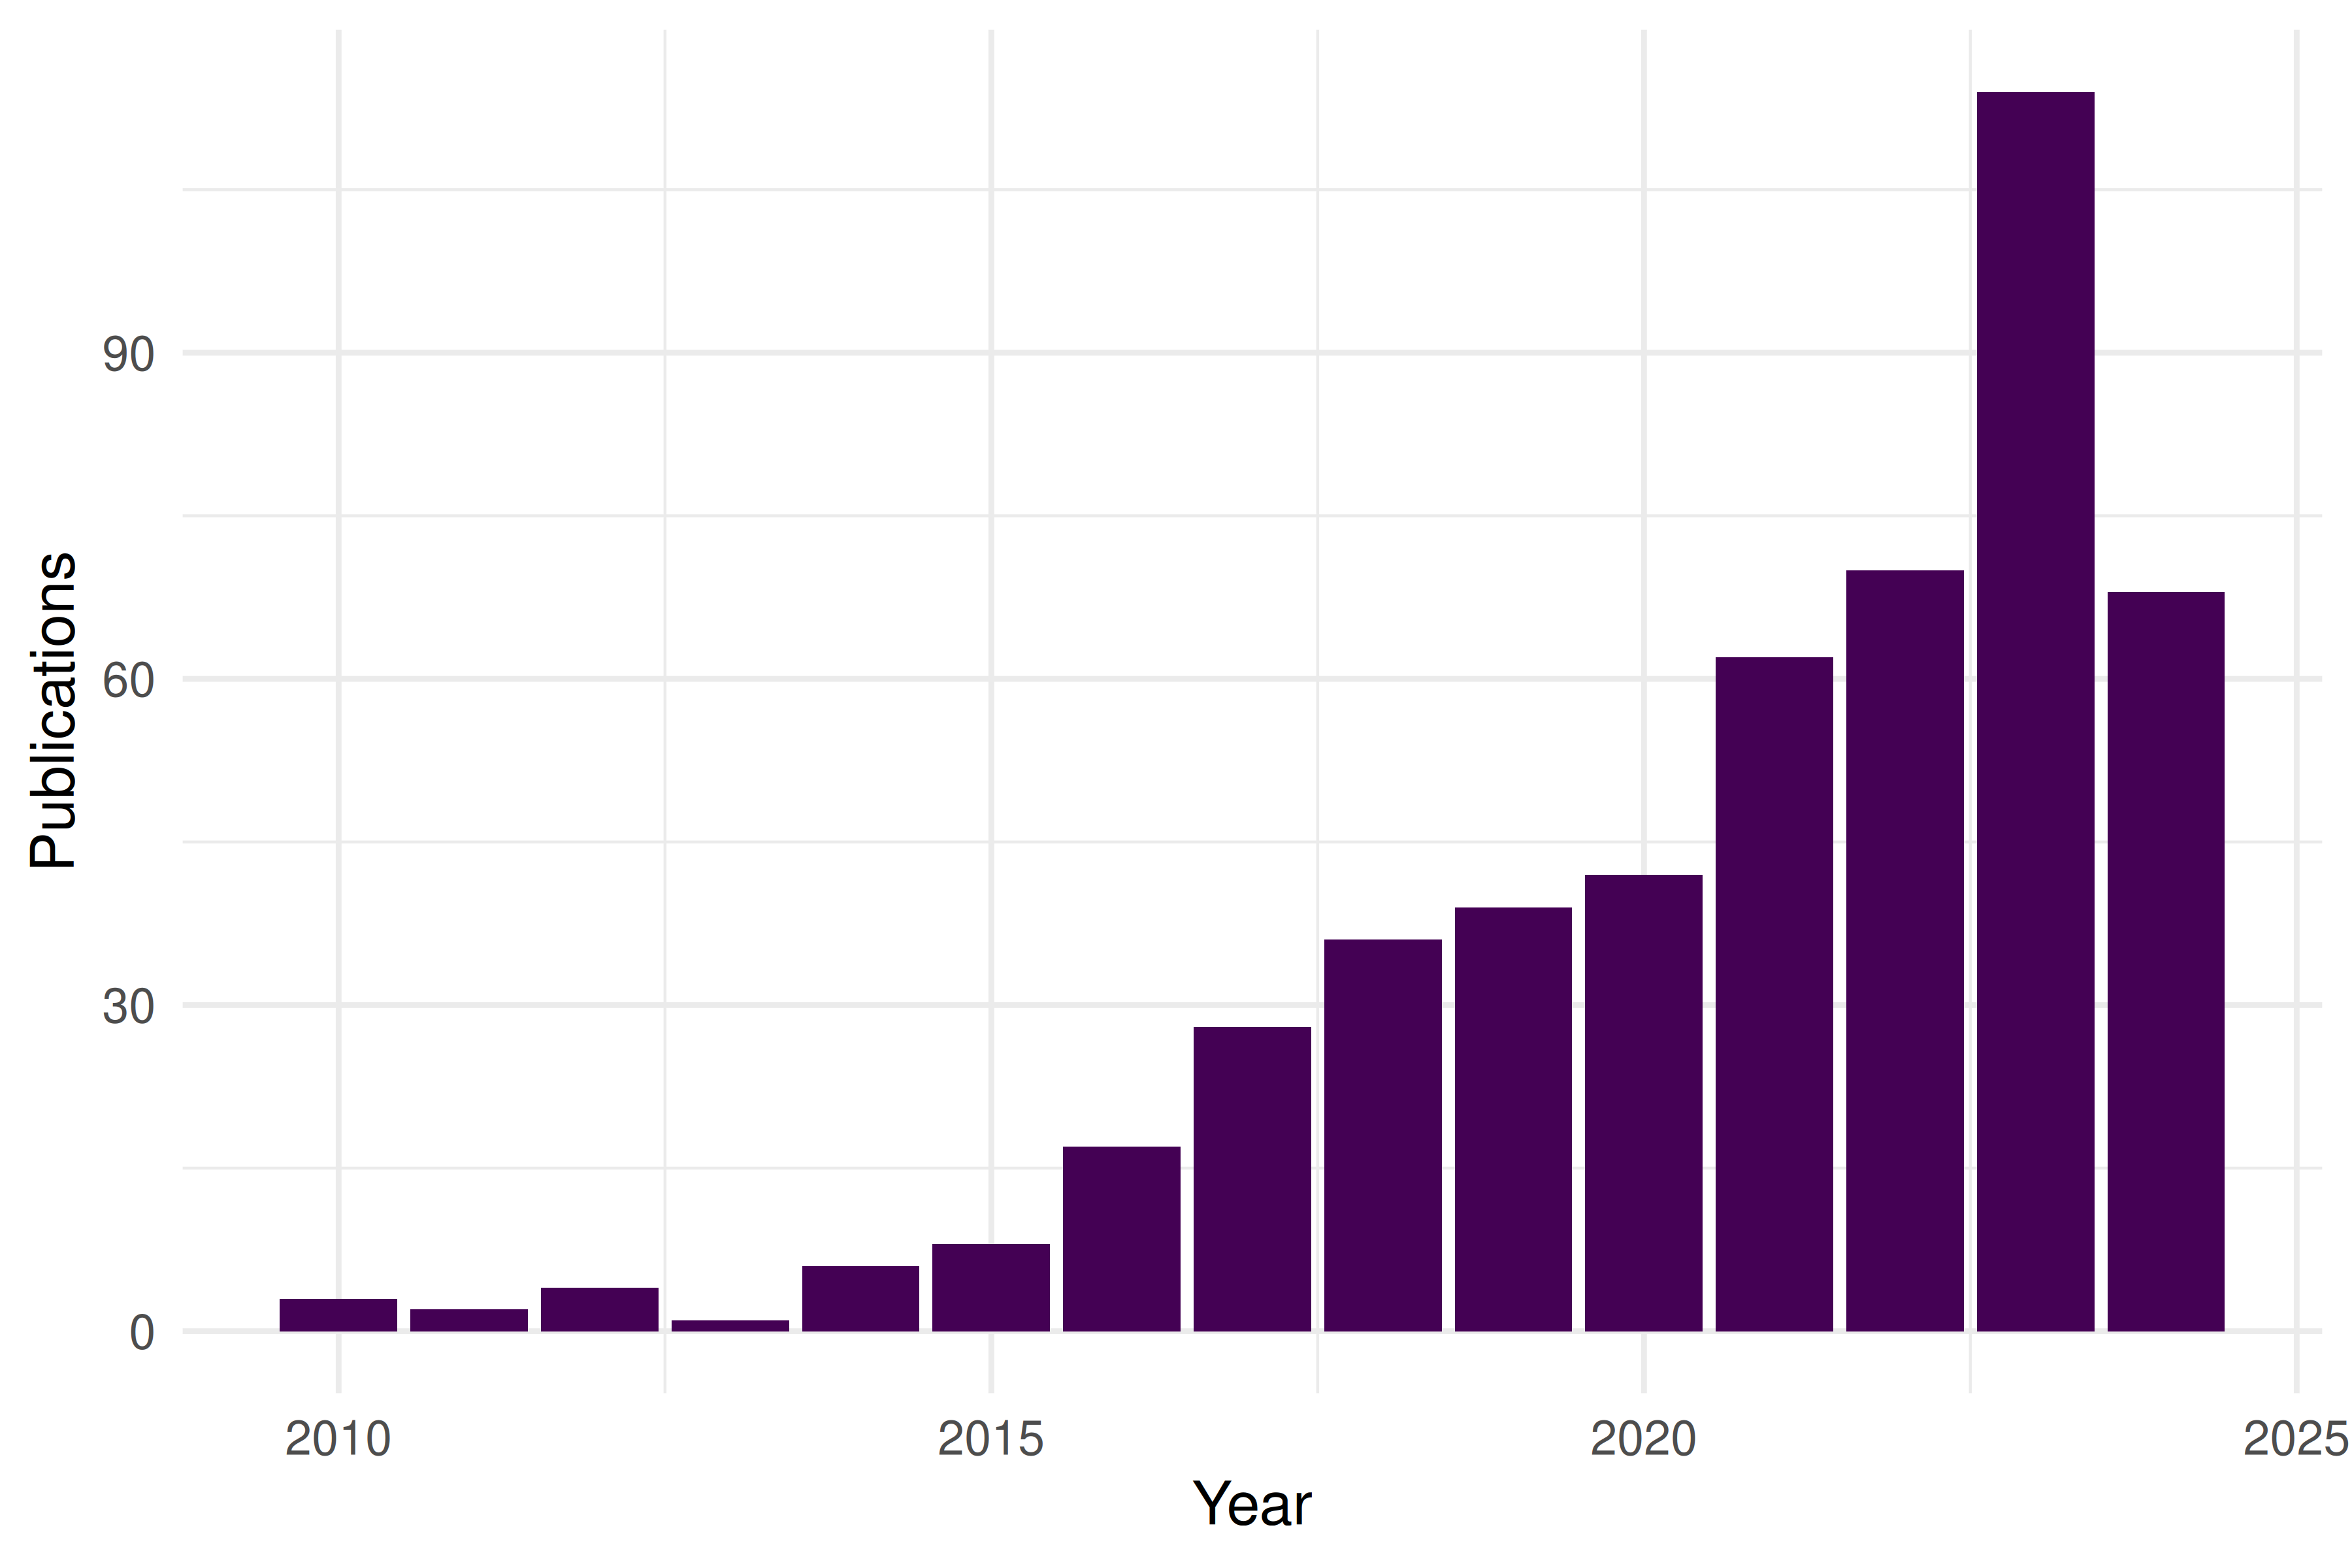
Figure 39.1: Annual publication output in the CRISPR field.
39.5 Citation landscape
ggplot(works, aes(x = cited_by_count)) +
  geom_histogram(binwidth = 10, fill = palette_sci(1), colour = "white") +
  labs(x = "Citations", y = "Papers") +
  theme_sci()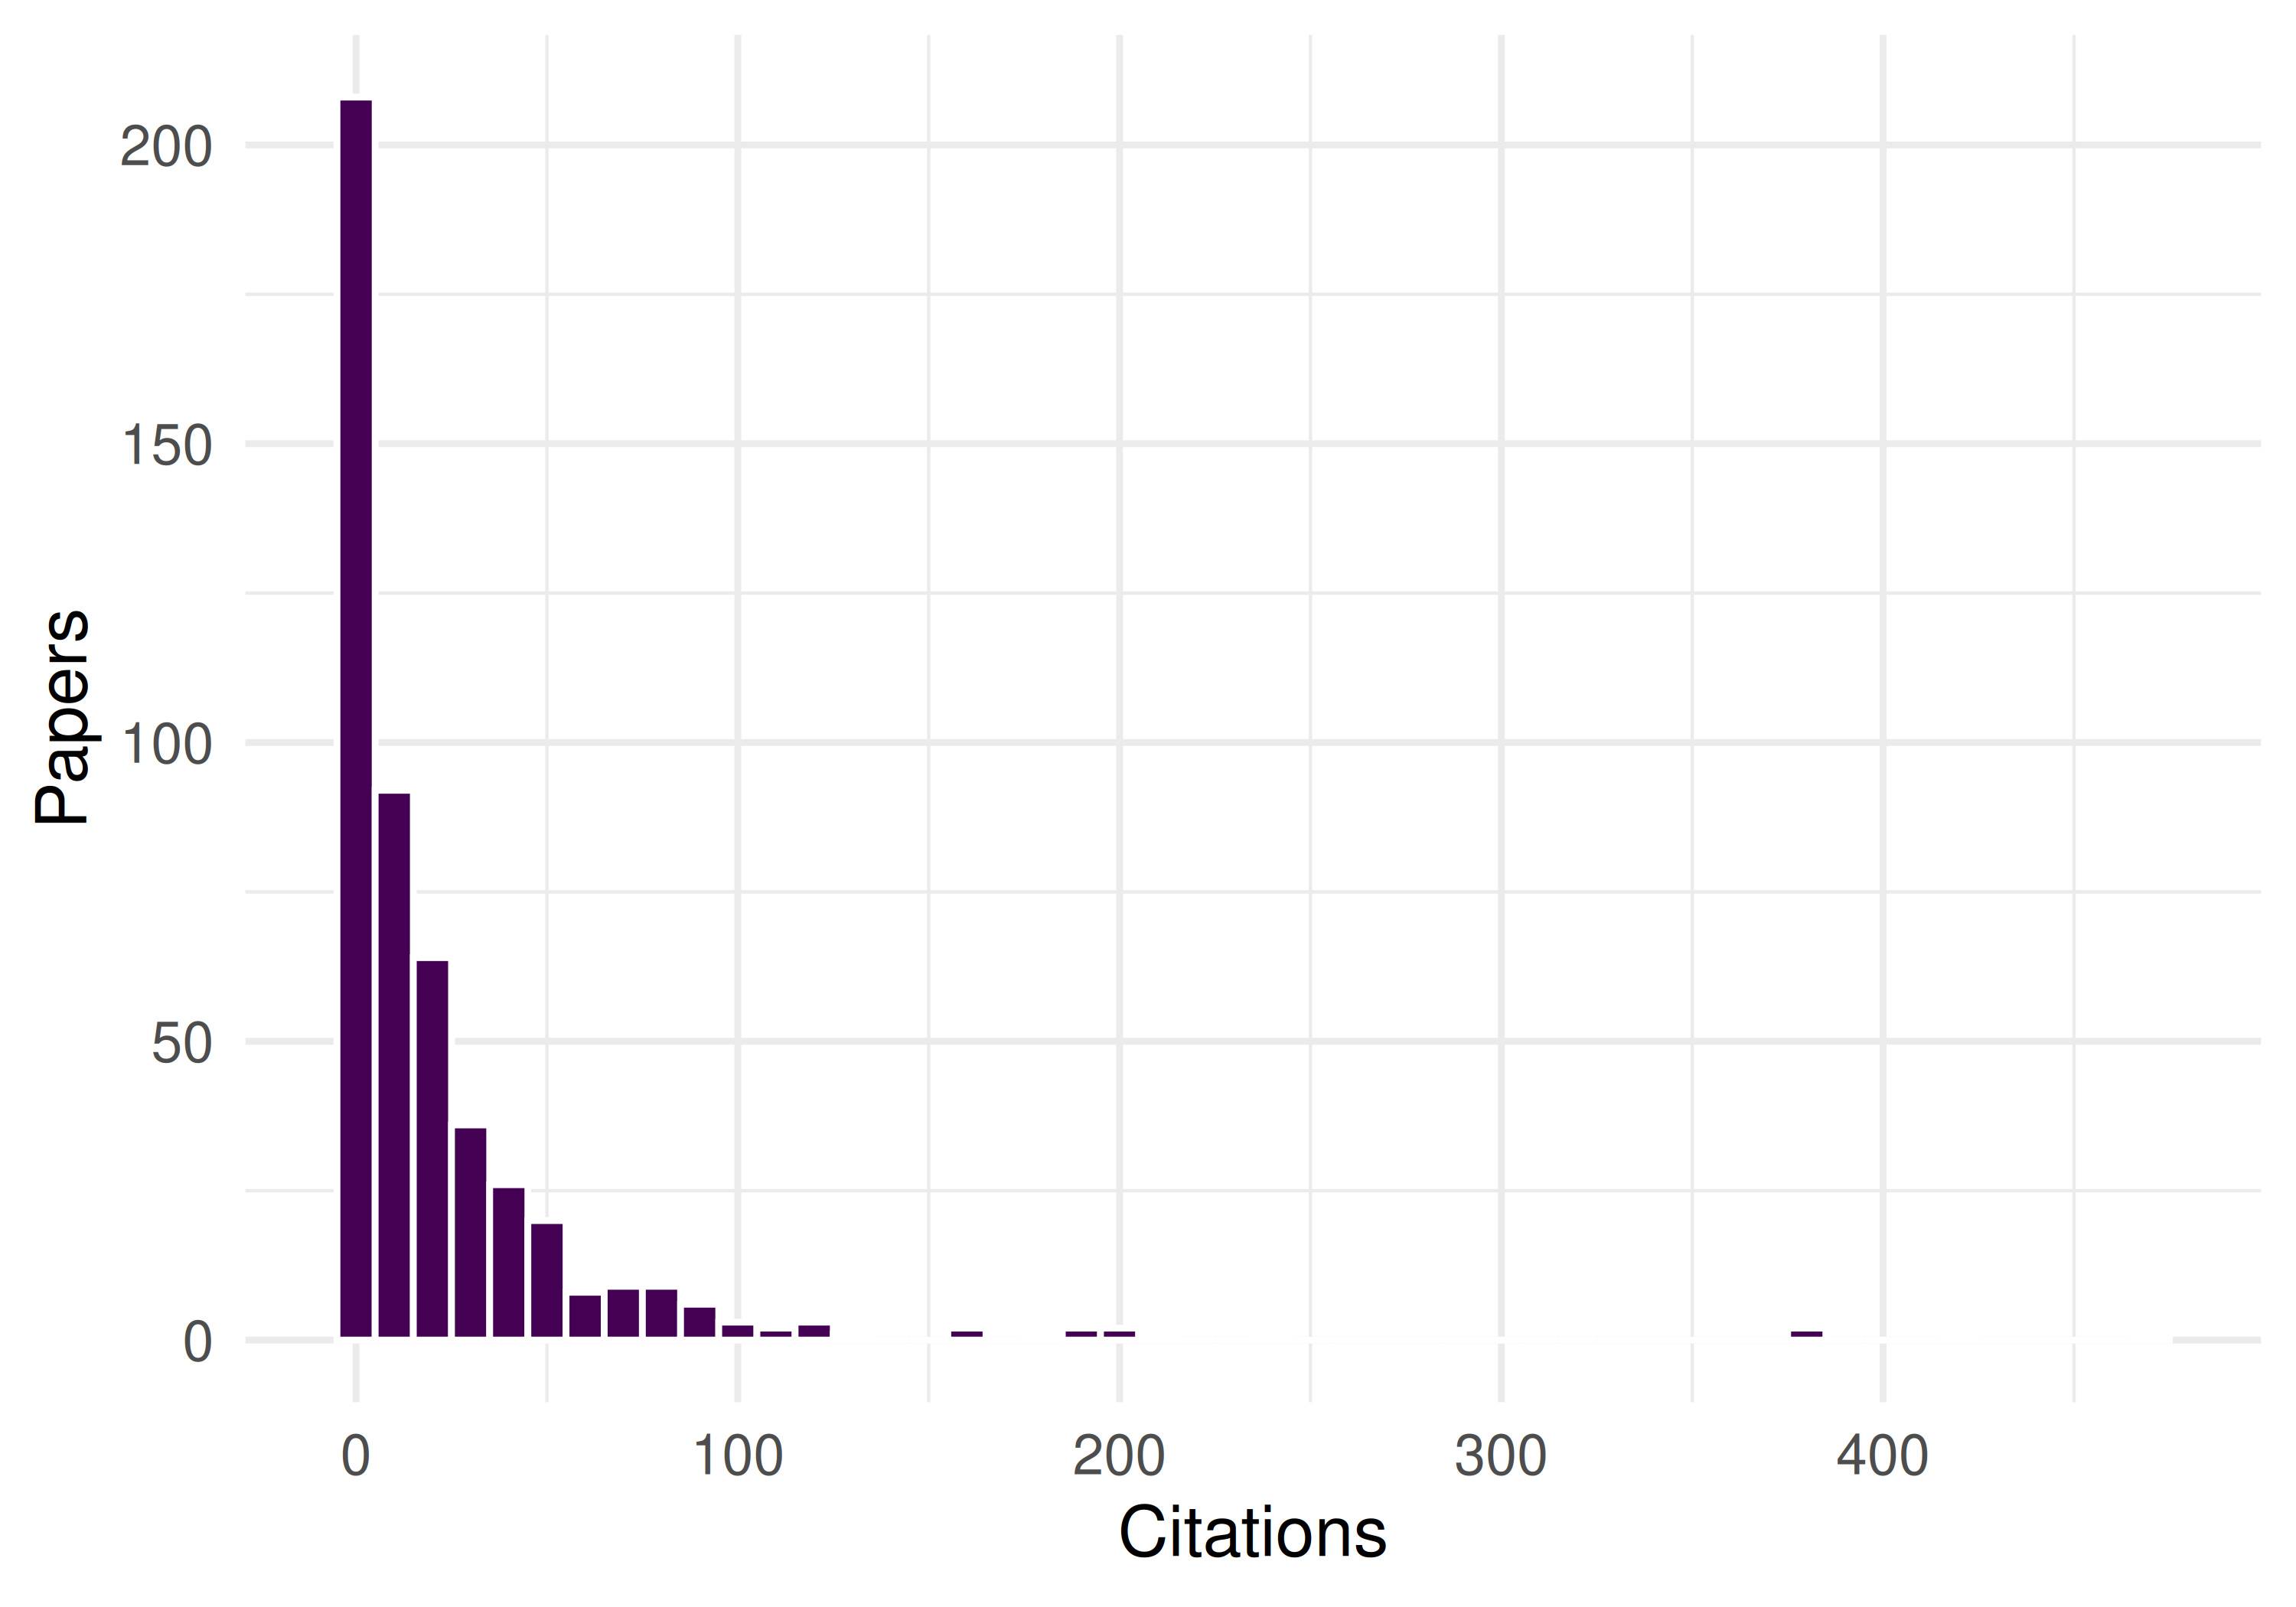
Figure 39.2: Citation distribution of CRISPR articles.
works |>
  arrange(desc(cited_by_count)) |>
  head(10) |>
  select(display_name, year, cited_by_count, source_display_name) |>
gt()| display_name | year | cited_by_count | source_display_name |
|---|---|---|---|
| Computational correction of copy number effect improves specificity of CRISPR–Cas9 essentiality screens in cancer cells | 2017 | 2146 | Nature Genetics |
| Genome editing with RNA-guided Cas9 nuclease in Zebrafish embryos | 2013 | 831 | Cell Research |
| An enhanced CRISPR repressor for targeted mammalian gene regulation | 2018 | 533 | Nature Methods |
| Circular RNA DLGAP4 Ameliorates Ischemic Stroke Outcomes by Targeting miR-143 to Regulate Endothelial-Mesenchymal Transition Associated with Blood–Brain Barrier Integrity | 2017 | 381 | Journal of Neuroscience |
| Multiplexed genome engineering by Cas12a and CRISPR arrays encoded on single transcripts | 2019 | 303 | Nature Methods |
| Targeting GLP-1 receptor trafficking to improve agonist efficacy | 2018 | 281 | Nature Communications |
| Human SHMT inhibitors reveal defective glycine import as a targetable metabolic vulnerability of diffuse large B-cell lymphoma | 2017 | 266 | Proceedings of the National Academy of Sciences |
| Homo-PROTACs: bivalent small-molecule dimerizers of the VHL E3 ubiquitin ligase to induce self-degradation | 2017 | 238 | Nature Communications |
| NSUN2 modified by SUMO-2/3 promotes gastric cancer progression and regulates mRNA m5C methylation | 2021 | 238 | Cell Death and Disease |
| Milk exosomes-mediated miR-31-5p delivery accelerates diabetic wound healing through promoting angiogenesis | 2022 | 237 | Drug Delivery |
39.6 Co-authorship network
author_data <- works |>
  select(id, authorships) |>
  unnest(authorships, names_sep = "_") |>
  select(work_id = id, author_id = authorships_id,
         author_name = authorships_display_name) |>
  filter(!is.na(author_id))

edges <- author_data |>
  inner_join(author_data, by = "work_id", suffix = c("_1", "_2"),
             relationship = "many-to-many") |>
  filter(author_id_1 < author_id_2) |>
  count(author_id_1, author_id_2, name = "weight")

g <- graph_from_data_frame(
  edges |> select(author_id_1, author_id_2, weight),
  directed = FALSE
) |> simplify(edge.attr.comb = list(weight = "sum"))

comp <- components(g)
giant <- induced_subgraph(g, which(comp$membership == which.max(comp$csize)))
V(giant)$community <- as.factor(membership(
  cluster_leiden(giant, resolution_parameter = 1.0,
                 objective_function = "modularity")
))
V(giant)$degree <- degree(giant)

cat(glue("Network: {vcount(giant)} nodes, {ecount(giant)} edges\n"))
#> Network: 137 nodes, 4987 edges
set.seed(42)
ggraph(as_tbl_graph(giant), layout = "fr") +
  geom_edge_link(alpha = 0.1, colour = "grey60") +
  geom_node_point(aes(size = degree, colour = community), alpha = 0.7) +
  scale_size_continuous(range = c(0.5, 5), guide = "none") +
  scale_colour_manual(values = palette_sci(n_distinct(V(giant)$community))) +
  labs(colour = "Community") +
  theme_void(base_family = "sans", base_size = 11) + theme(legend.position = "bottom")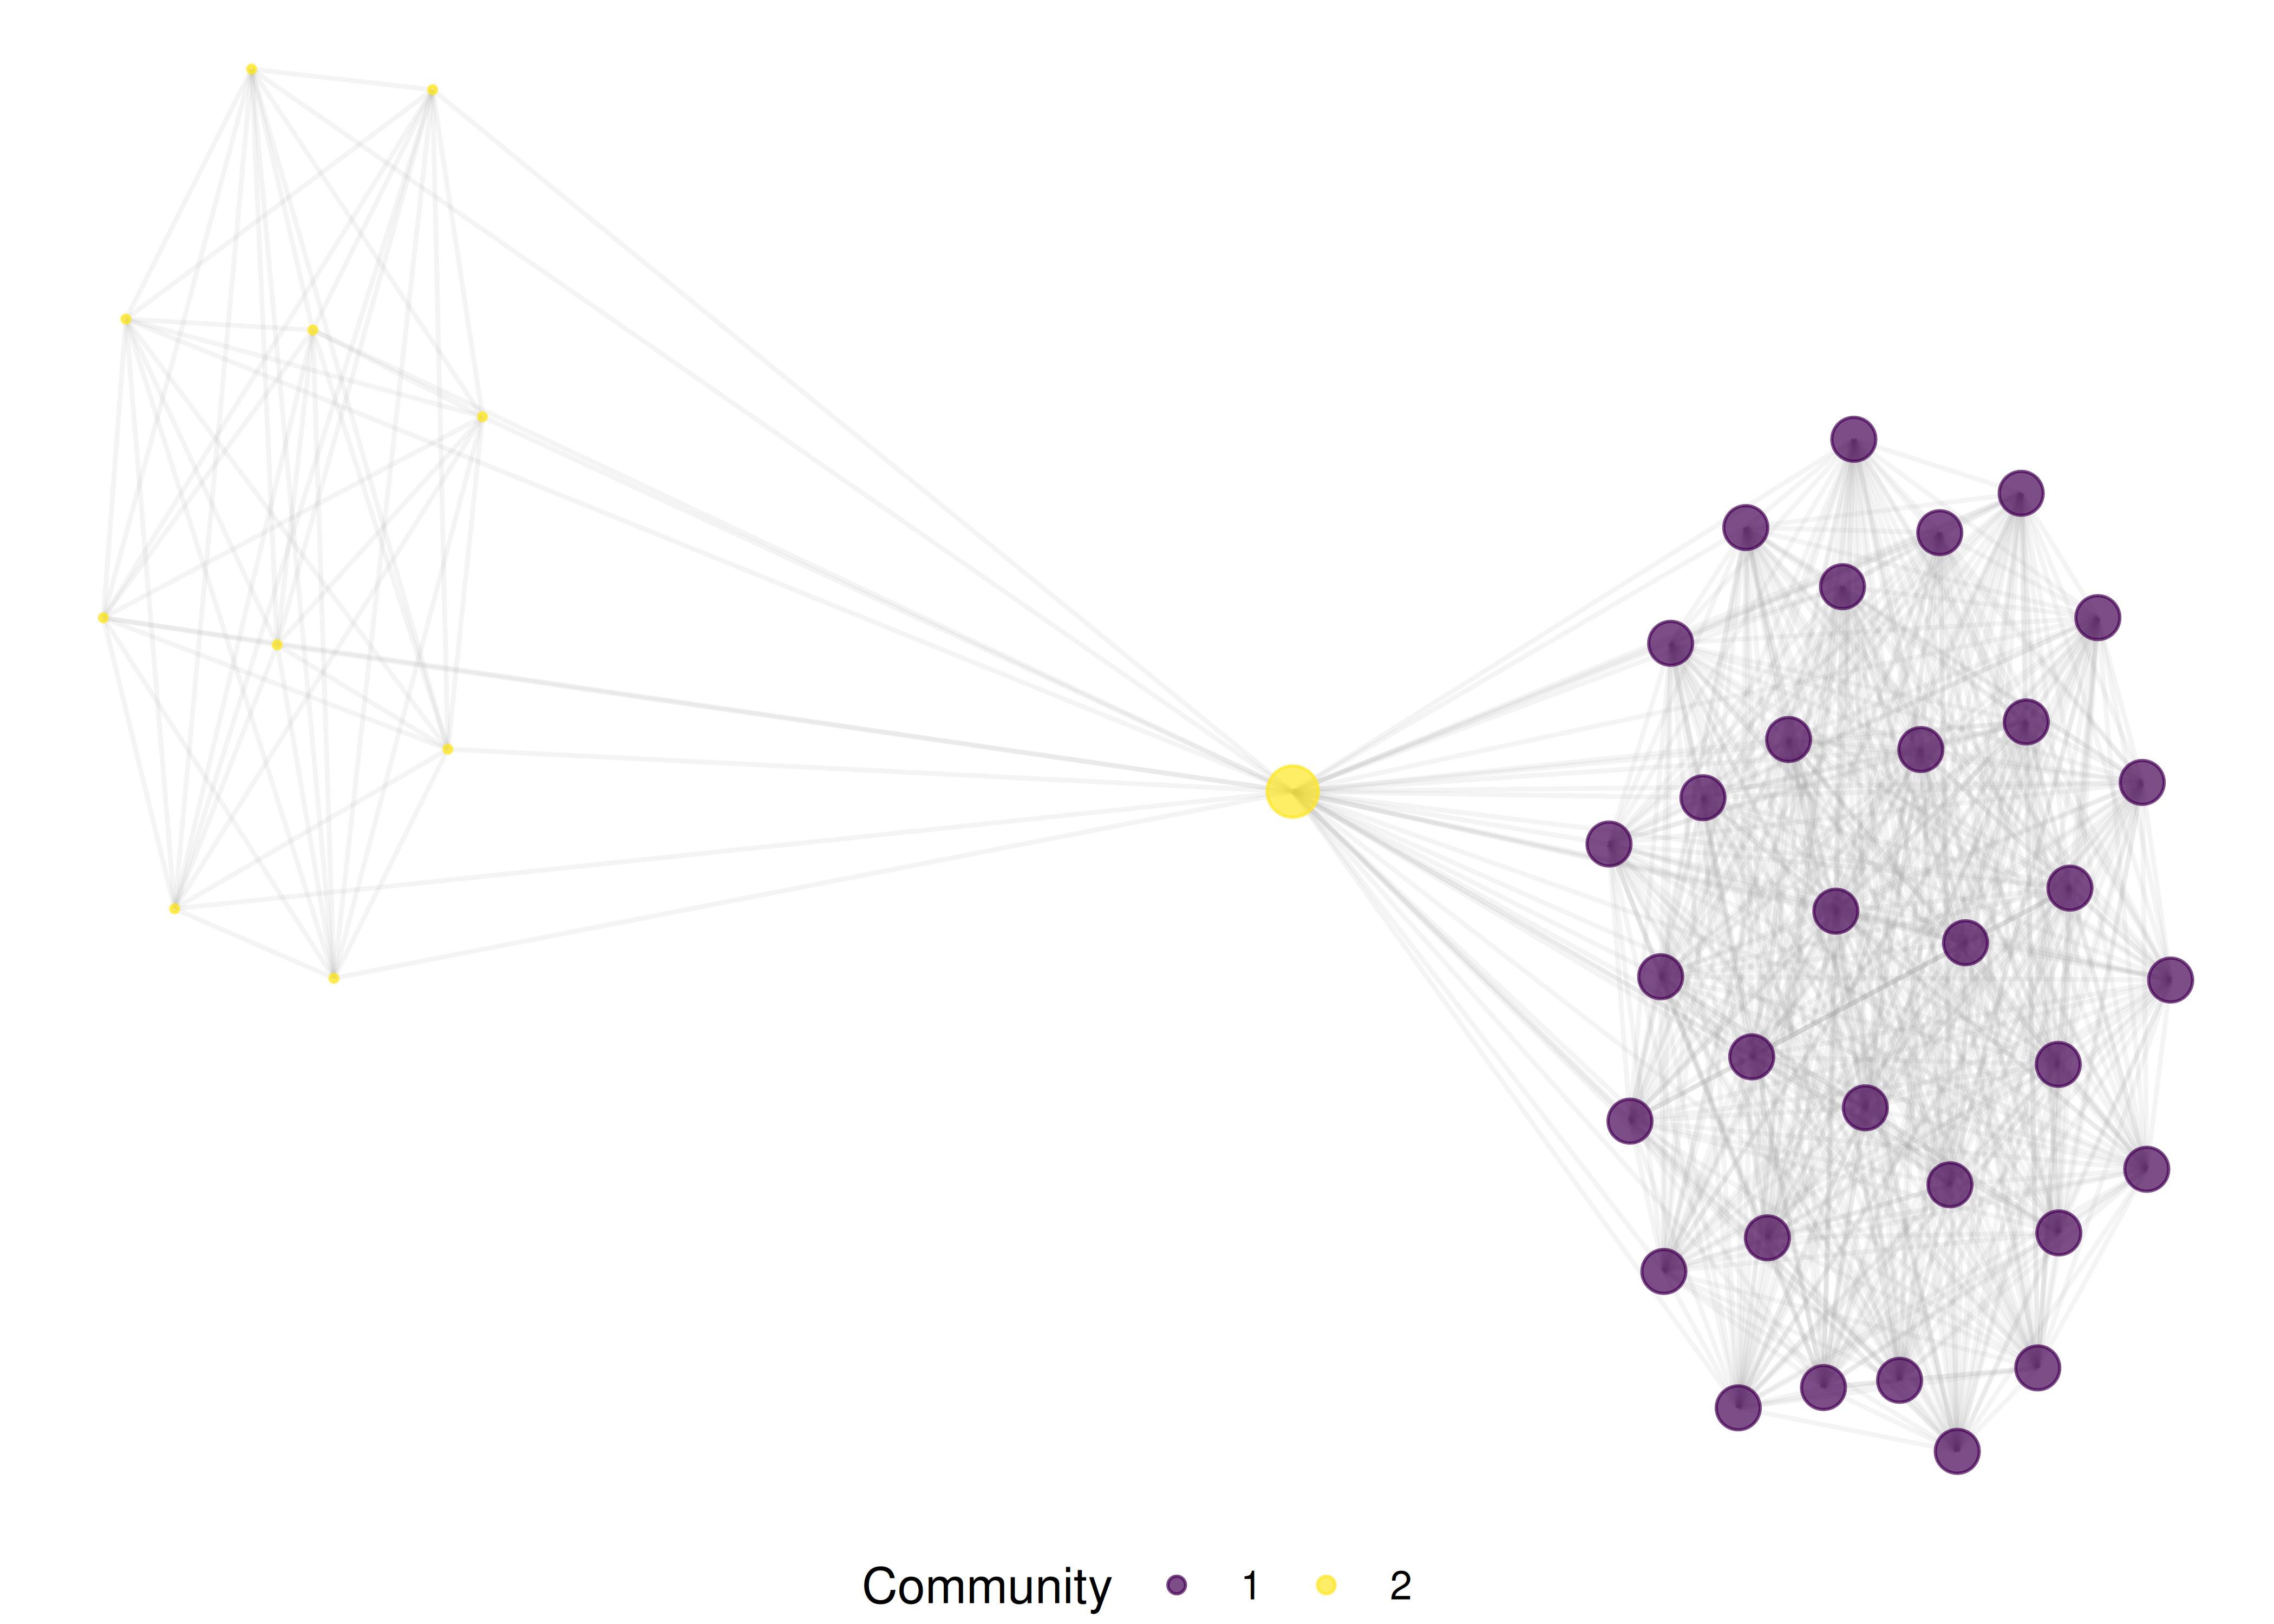
Figure 39.3: Co-authorship network of CRISPR researchers.
39.7 Topic evolution
text_df <- works |>
  filter(!is.na(abstract), nchar(abstract) > 50) |>
  transmute(doc_id = id, text = paste(display_name, abstract, sep = ". "), year)

corp <- corpus(text_df, docid_field = "doc_id", text_field = "text")
toks <- tokens(corp, remove_punct = TRUE, remove_numbers = TRUE) |>
  tokens_tolower() |>
  tokens_remove(stopwords("en")) |>
  tokens_remove(c("study", "paper", "results", "using", "based"))

dfmat <- dfm(toks) |> dfm_trim(min_termfreq = 5, min_docfreq = 3)

top_by_year <- map_dfr(unique(text_df$year), function(yr) {
  docs <- docvars(dfmat, "year") == yr
  if (sum(docs) < 5) return(tibble())
  top <- topfeatures(dfmat[docs, ], 5)
  tibble(year = yr, term = names(top), freq = unname(top))
})
top_by_year |>
  group_by(year) |>
  mutate(term = reorder_within(term, freq, year)) |>
  ggplot(aes(x = freq, y = term)) +
  geom_col(fill = palette_sci(1)) +
  facet_wrap(~ year, scales = "free_y", ncol = 4) +
  scale_y_reordered() +
  labs(x = "Frequency", y = NULL) +
  theme_sci(base_size = 8)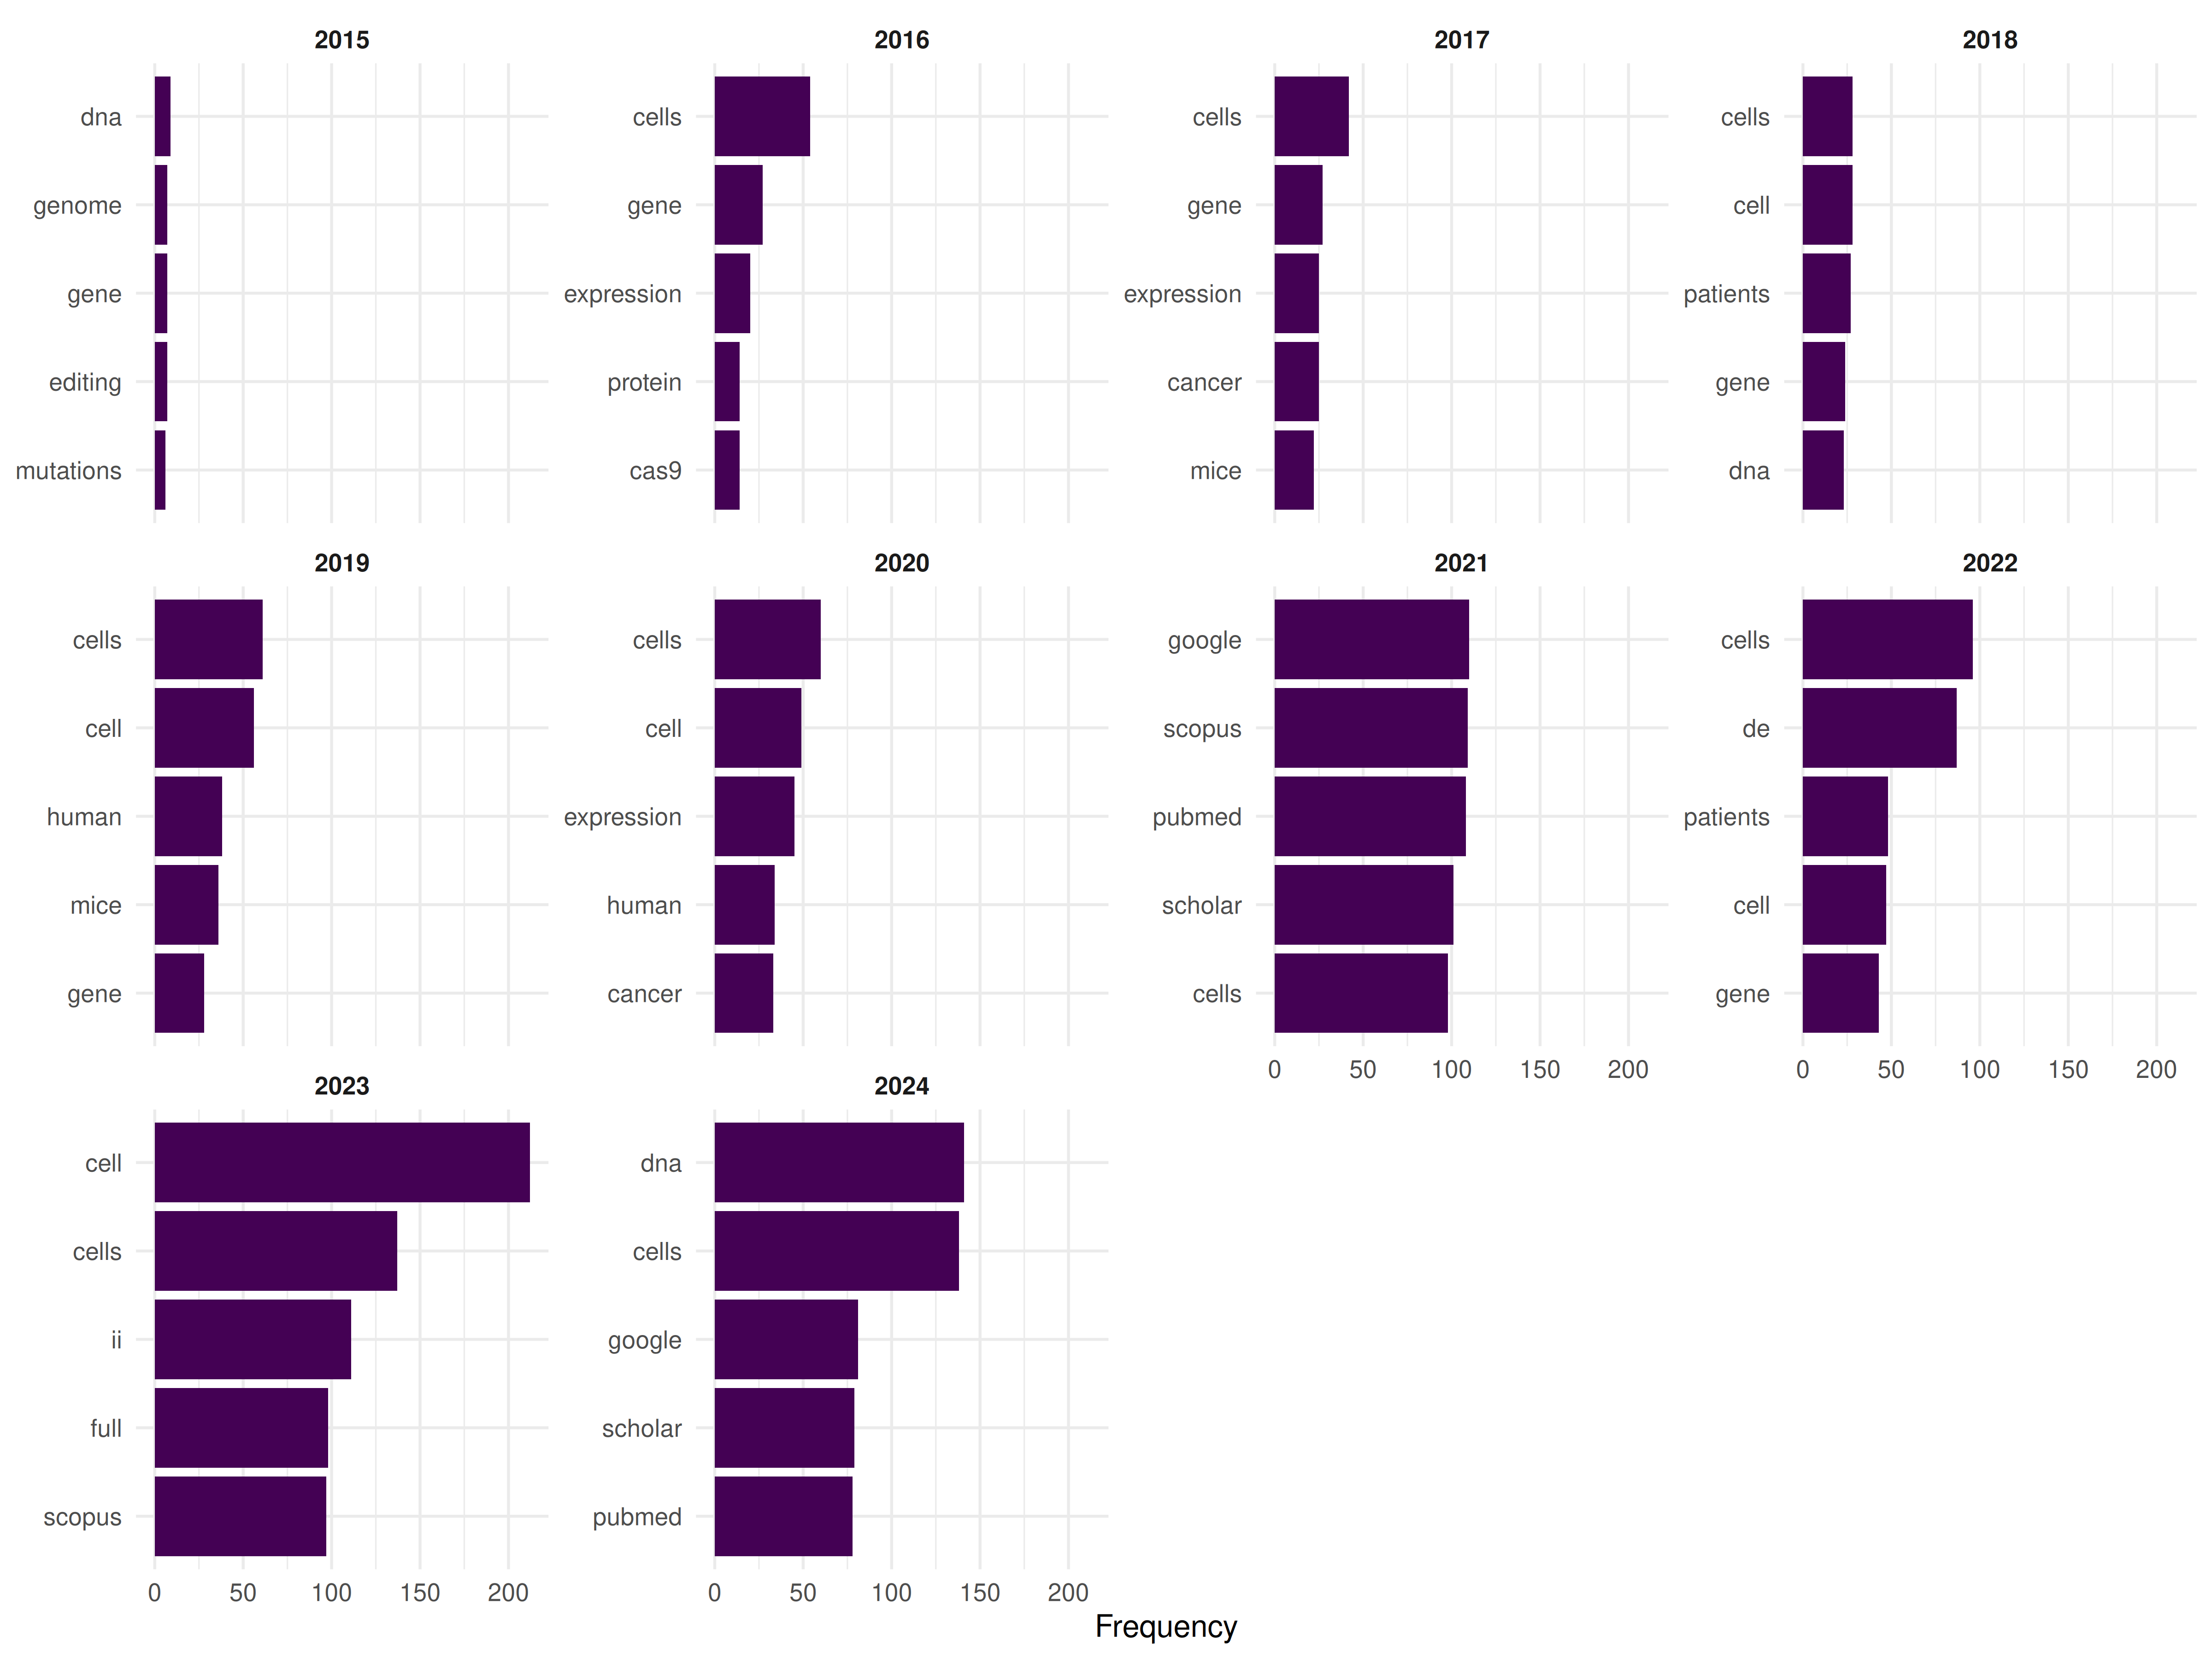
Figure 39.4: Top terms by year showing topical evolution.
39.8 Key findings
- Explosive growth: CRISPR publications grew exponentially from 2012, reflecting the rapid adoption of Cas9-based editing.
- Citation concentration: A small number of foundational papers dominate the citation landscape.
- Collaborative structure: The co-authorship network shows distinct communities, likely corresponding to different application domains (therapeutics, agriculture, basic biology).
- Topic evolution: Early terms focus on methodology; later years shift toward applications and clinical translation.
39.9 Lessons learned
- OpenAlex sampling provides a representative snapshot but may miss some highly specialised or non-English publications.
- The citation distribution is extreme: median citations are far below the mean, making median-based statistics essential.
- Co-authorship networks in fast-growing fields are fragmented; many research groups work independently.
This book was built by the bookdown R package.